Facebook insights
With over a billion users, Facebook is a top platform for businesses—93% are active there. To make the most of it, Facebook Insights offers valuable data on page performance, audience engagement, and strategy effectiveness. This guide breaks down the six key sections of Insights, highlighting which metrics truly matter for your business.
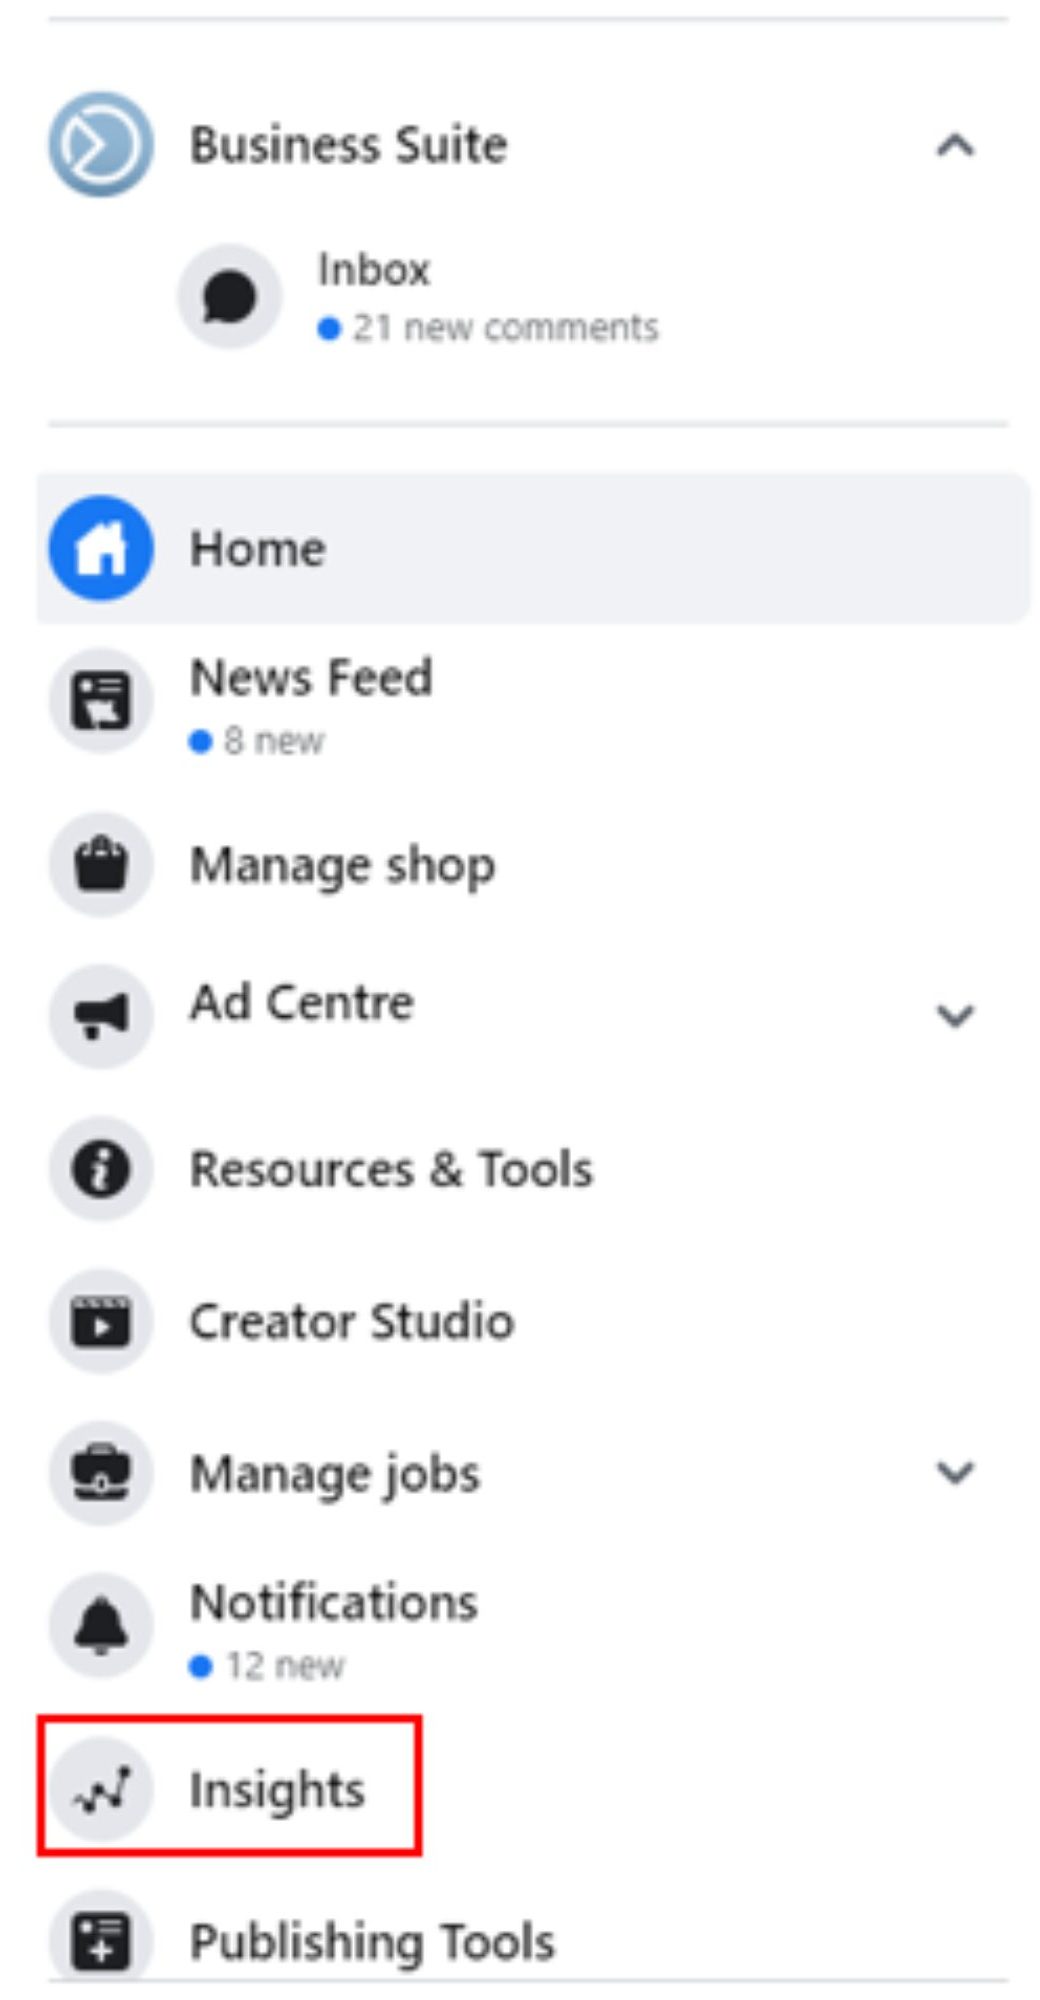
How to find Facebook Insights
Select “Insights” and voila, you’re in.
Overview
Within the Overview tab there are three importantsections:
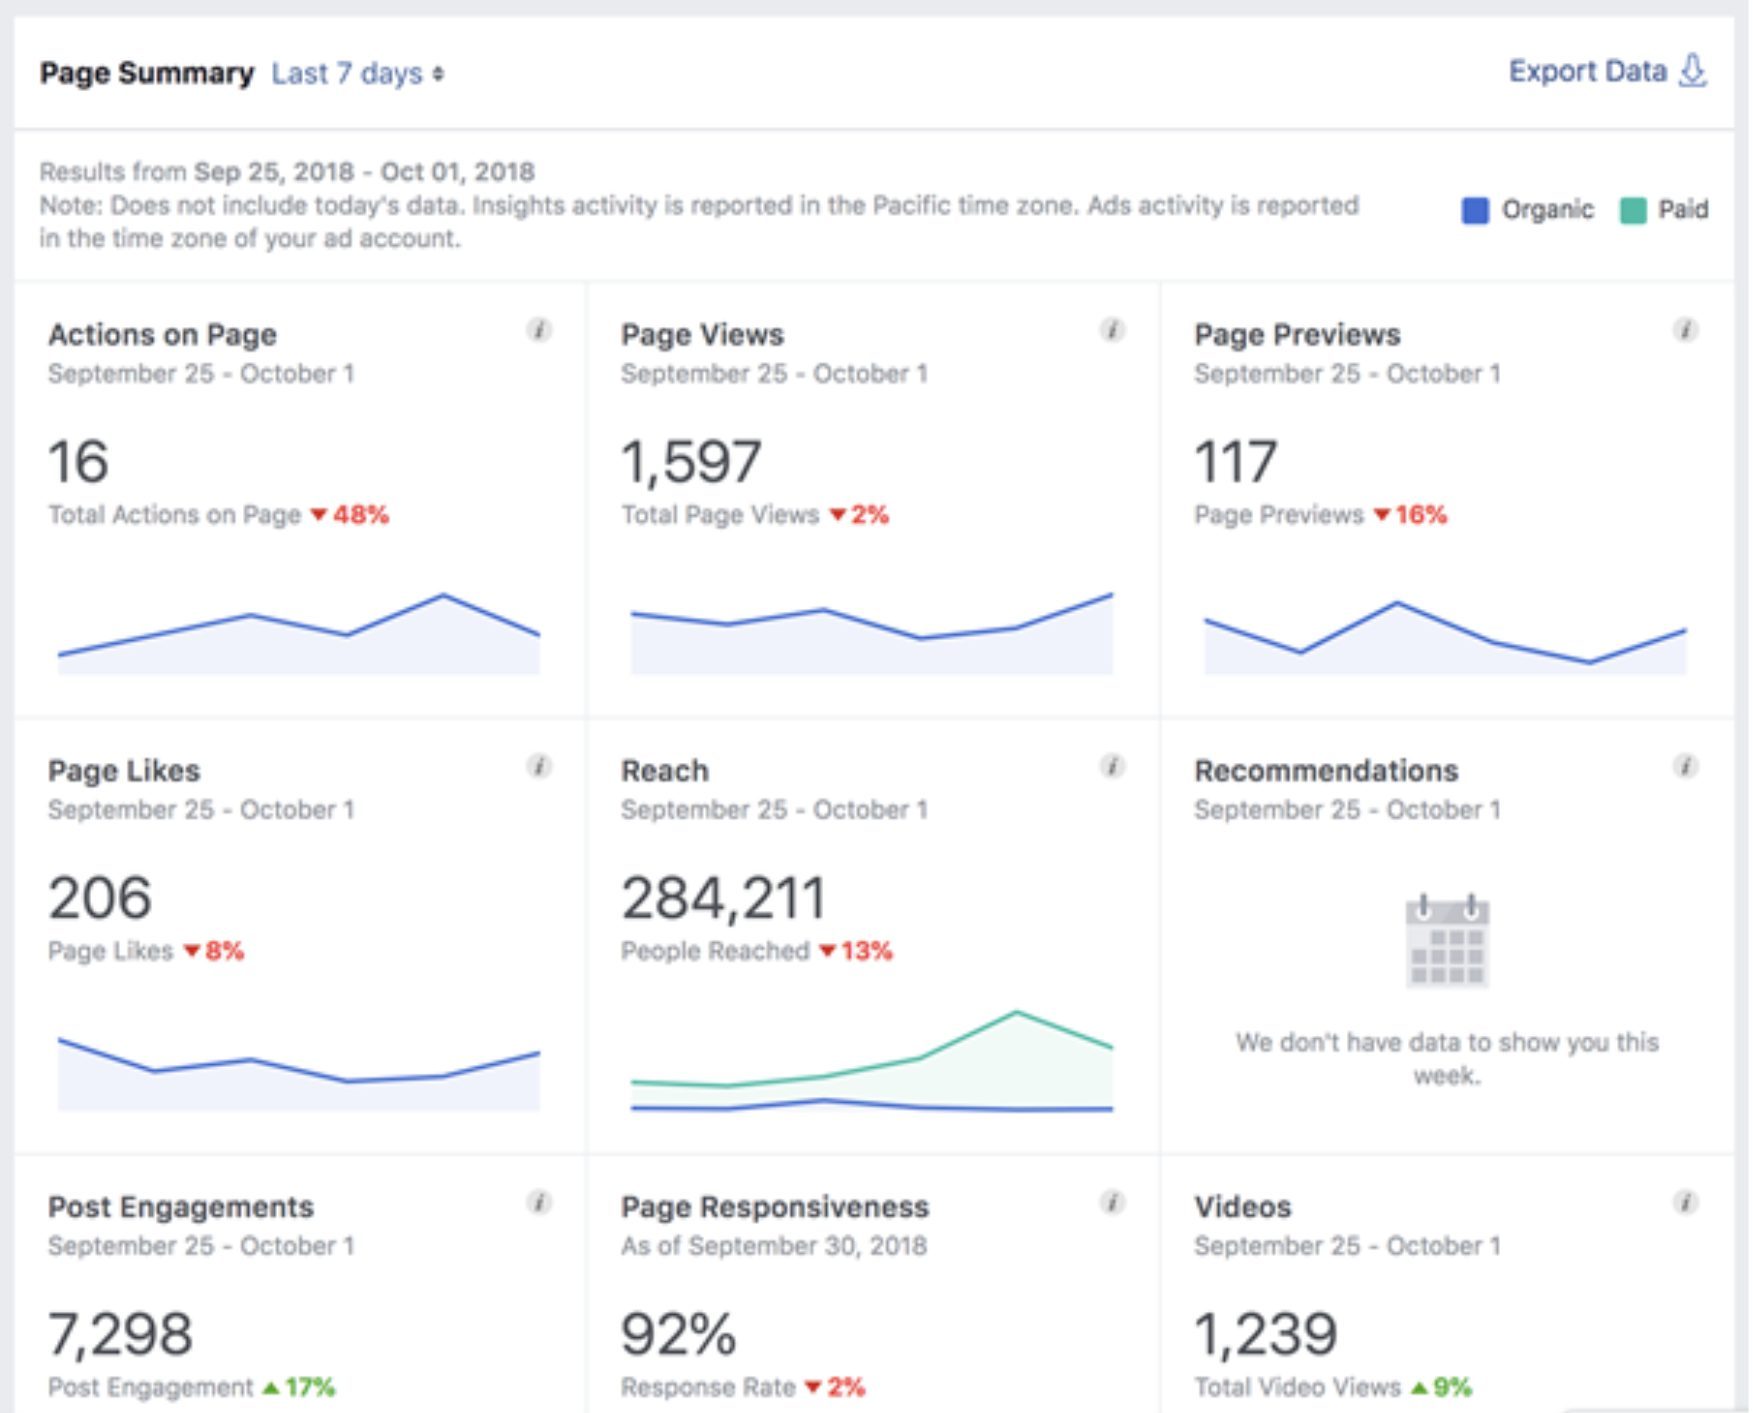
1. Page summary
2. Your five most recent posts
3. Pages to watch.
Let’s take a look at the information on offer within each.
Before we dive in, it’s worth brushing up on how to accessthese golden nuggets of information.
Log in to Facebook and head to your business page. Running along the top of the page, beneath the searchbar, are a number of tabs.
Here, you’ll see your page’s key metrics from the past week—Page Likes, Post Engagement, and Reach—along with percentage changes from the previous week to track trends. While reach and likes are helpful, focus on engagement, as engaged users are more likely to become customers.
Tip: Avoid fixating on “vanity metrics” that don’t impact your business success.
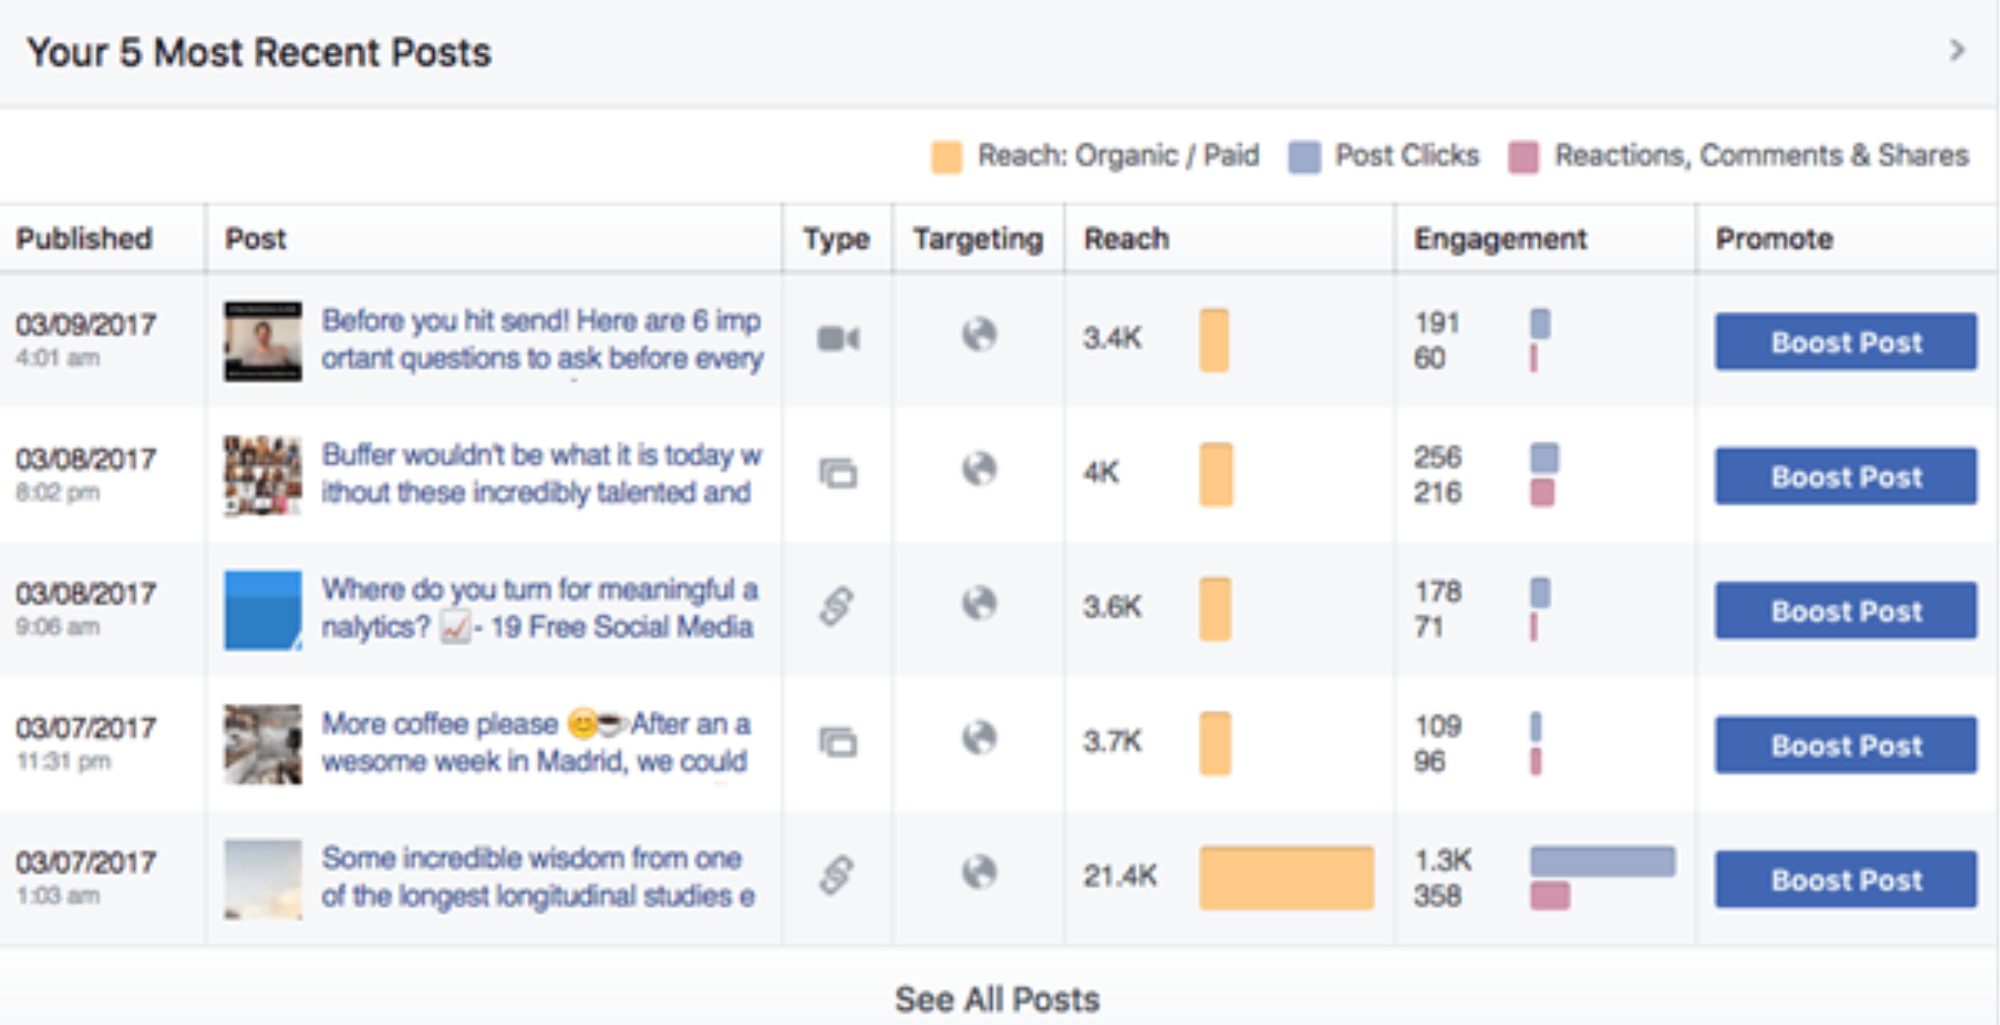
This section helps you see which content types resonate most with your audience. For example, if videos perform better than text posts, you can tailor future content accordingly.
Tip: Click on a post title for a detailed performance breakdown.
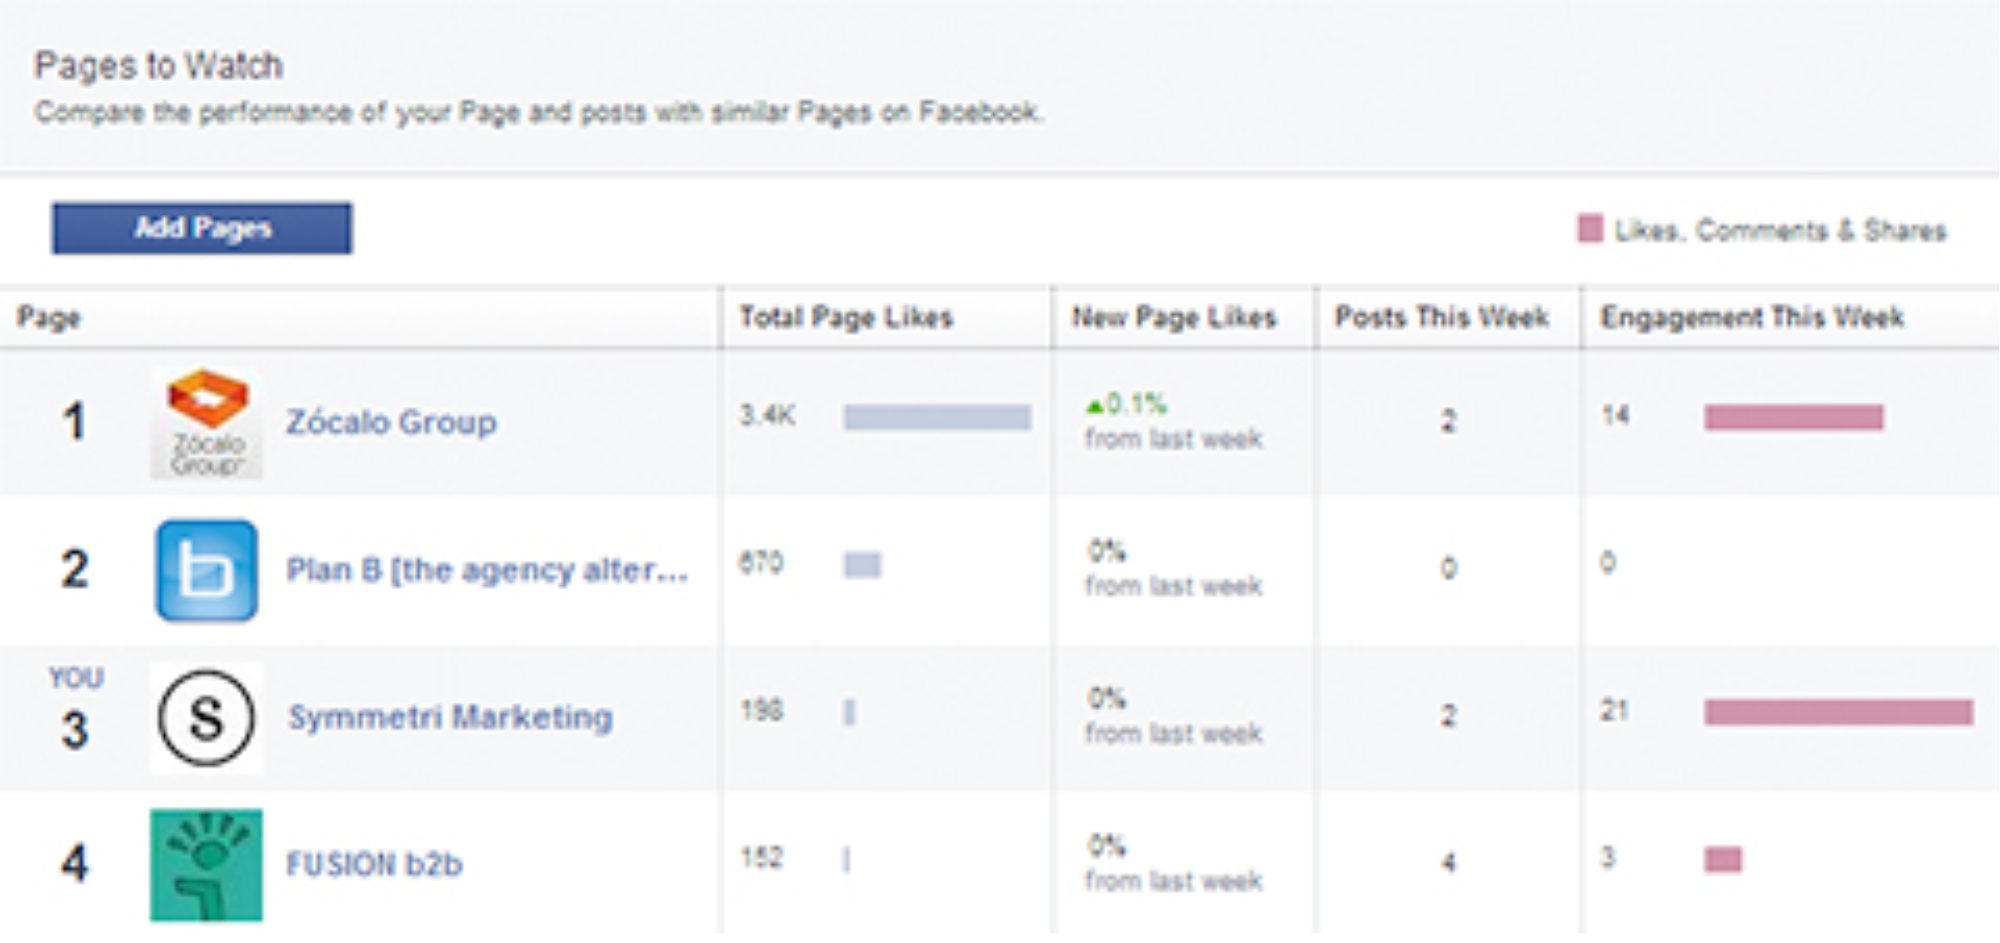
This feature lets you easily compare your page’s performance against competitors without manual snooping. Click on any listed page to see their top posts of the week, ranked by engagement, helping you spot trends in your industry. Don’t see a key competitor? Just ‘add pages’ to include them!
Likes
First, remember that total Likes are a vanity metric and don’t always reflect real business outcomes. That said, in the Likes tab on Insights, you’ll see:
- Total page likes today
- Net likes
- Where your page likes happened
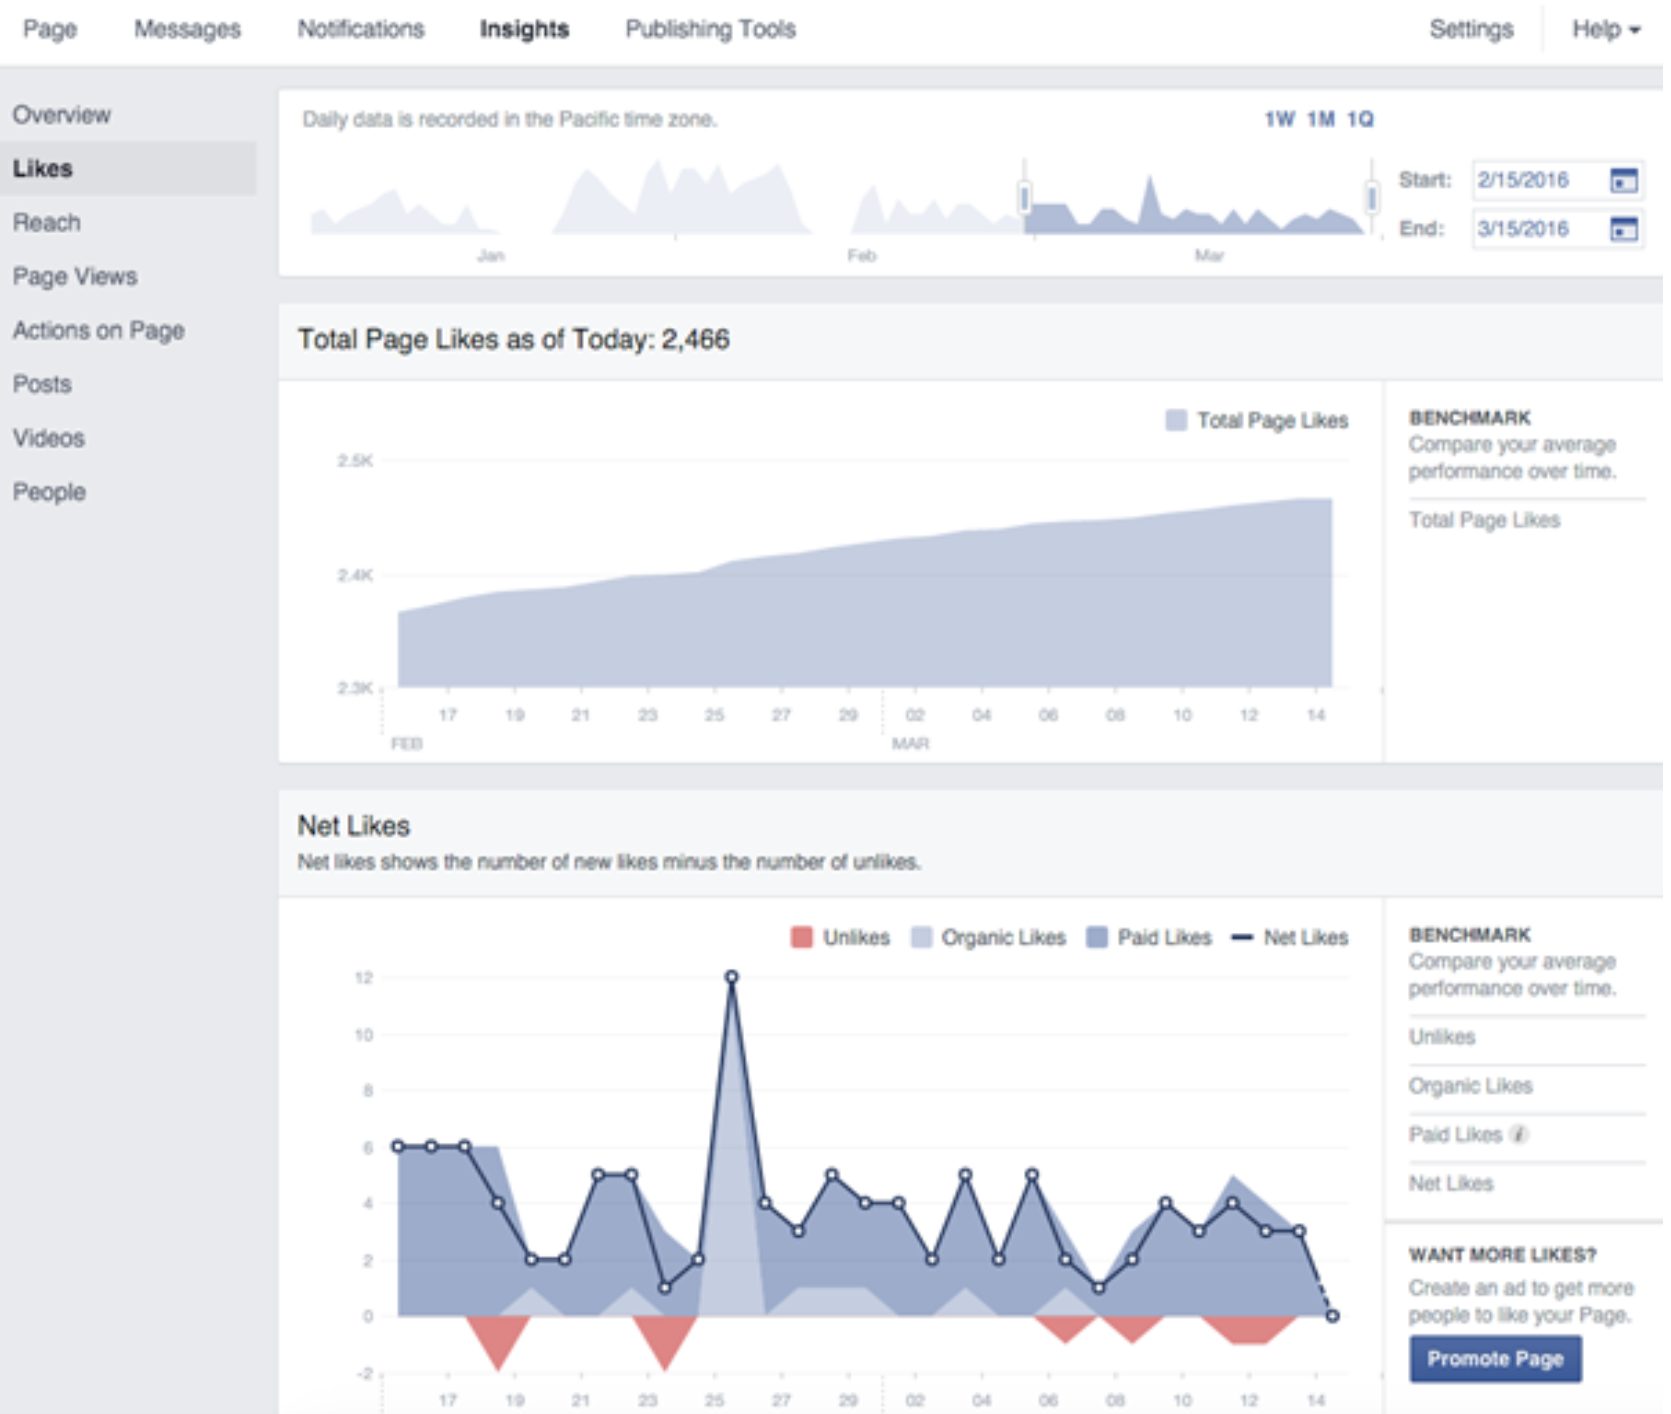
This graph shows the overall trend of your page likes. While likes aren’t everything, a downward trend is worth investigating to understand the cause.
‘Net likes’ shows new likes minus unlikes. While new likes are great, watch for increasing unlikes—they may need attention.
Tip: Select a date range on any graph to view Like and Unlike sources for that period.
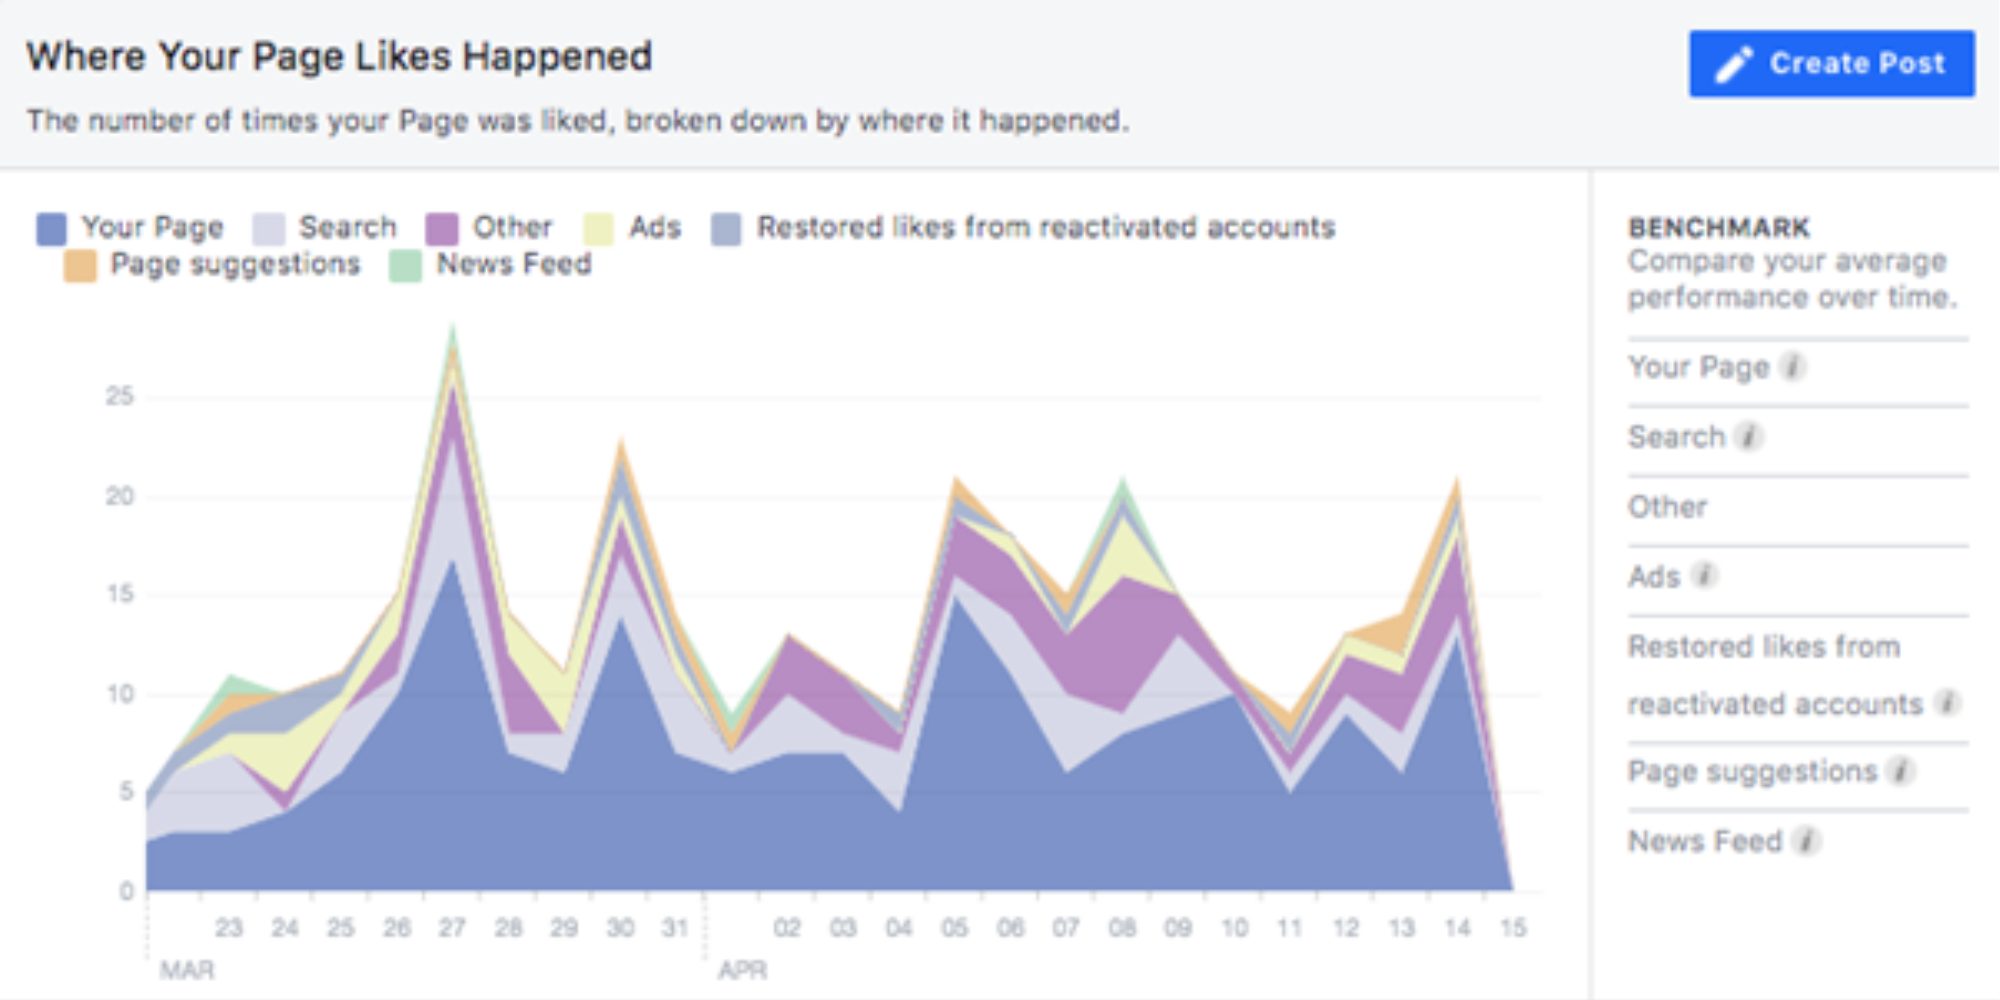
This graph shows where your page likes come from—useful for assessing your Facebook strategy. You’ll see if likes came from your page, Facebook suggestions, or ads. If ads aren’t driving likes, consider whether they’re worth the cost and adjust your strategy to improve ROI.
Reach
There are five sections to cover under Reach:
- Post reach
- Reactions, comments, and shares
- Reactions
- Hide, report as spam, and unlikes
- Total reach

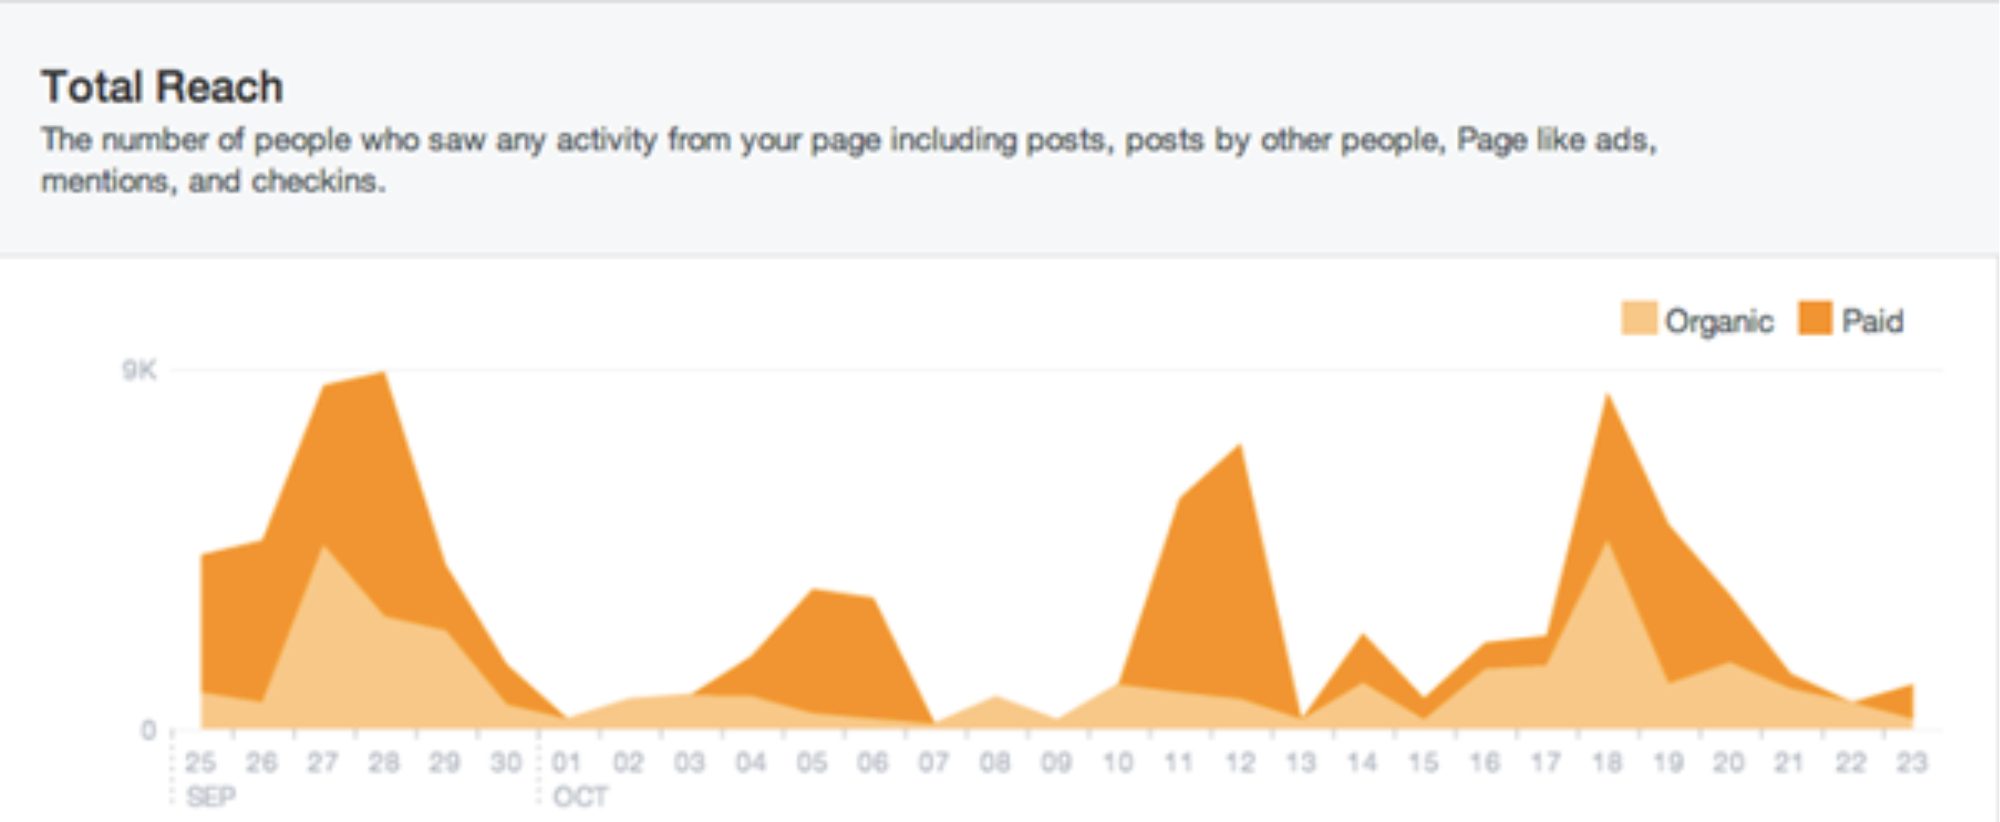
This graph shows your posts’ total reach, split into organic and paid sources. While reach isn’t a perfect success metric, it helps ensure you’re on track and shows if paid efforts are effective.
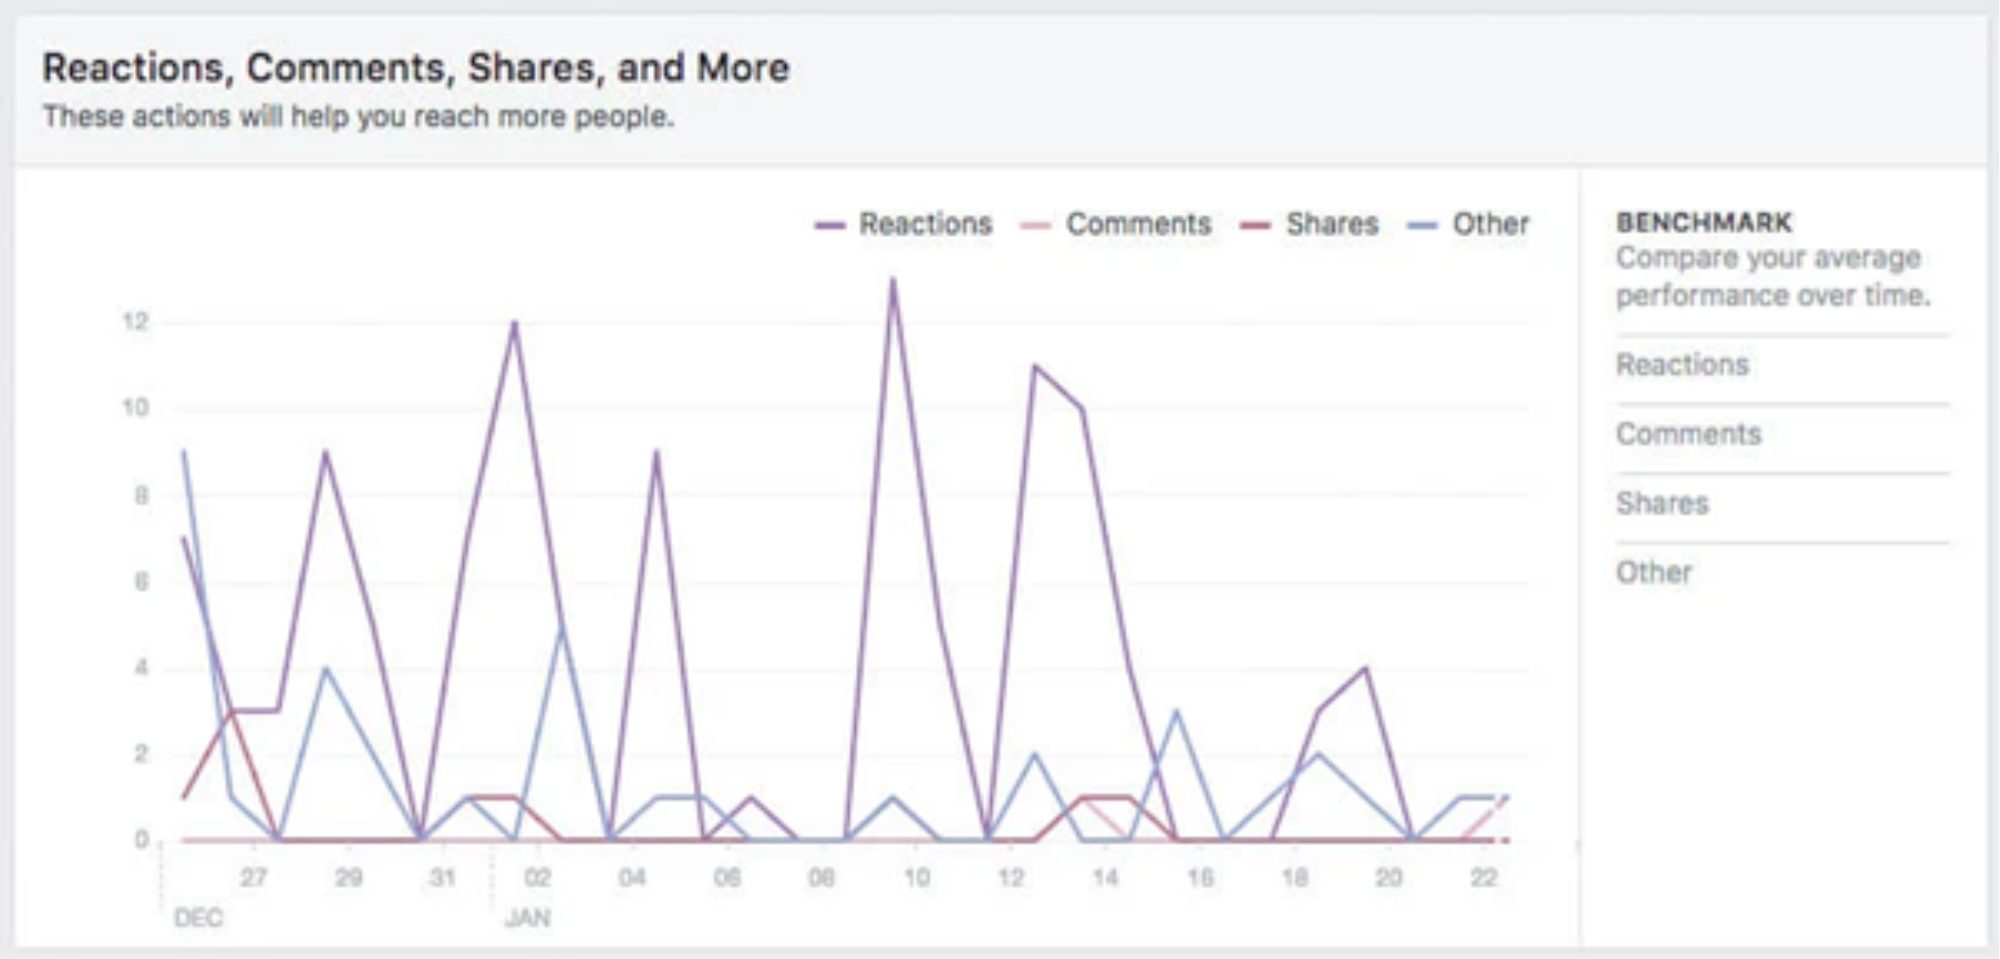
Reactions, comments, and shares are key engagement metrics that matter. High engagement signals interest, prompting Facebook’s algorithm to boost the post’s reach.
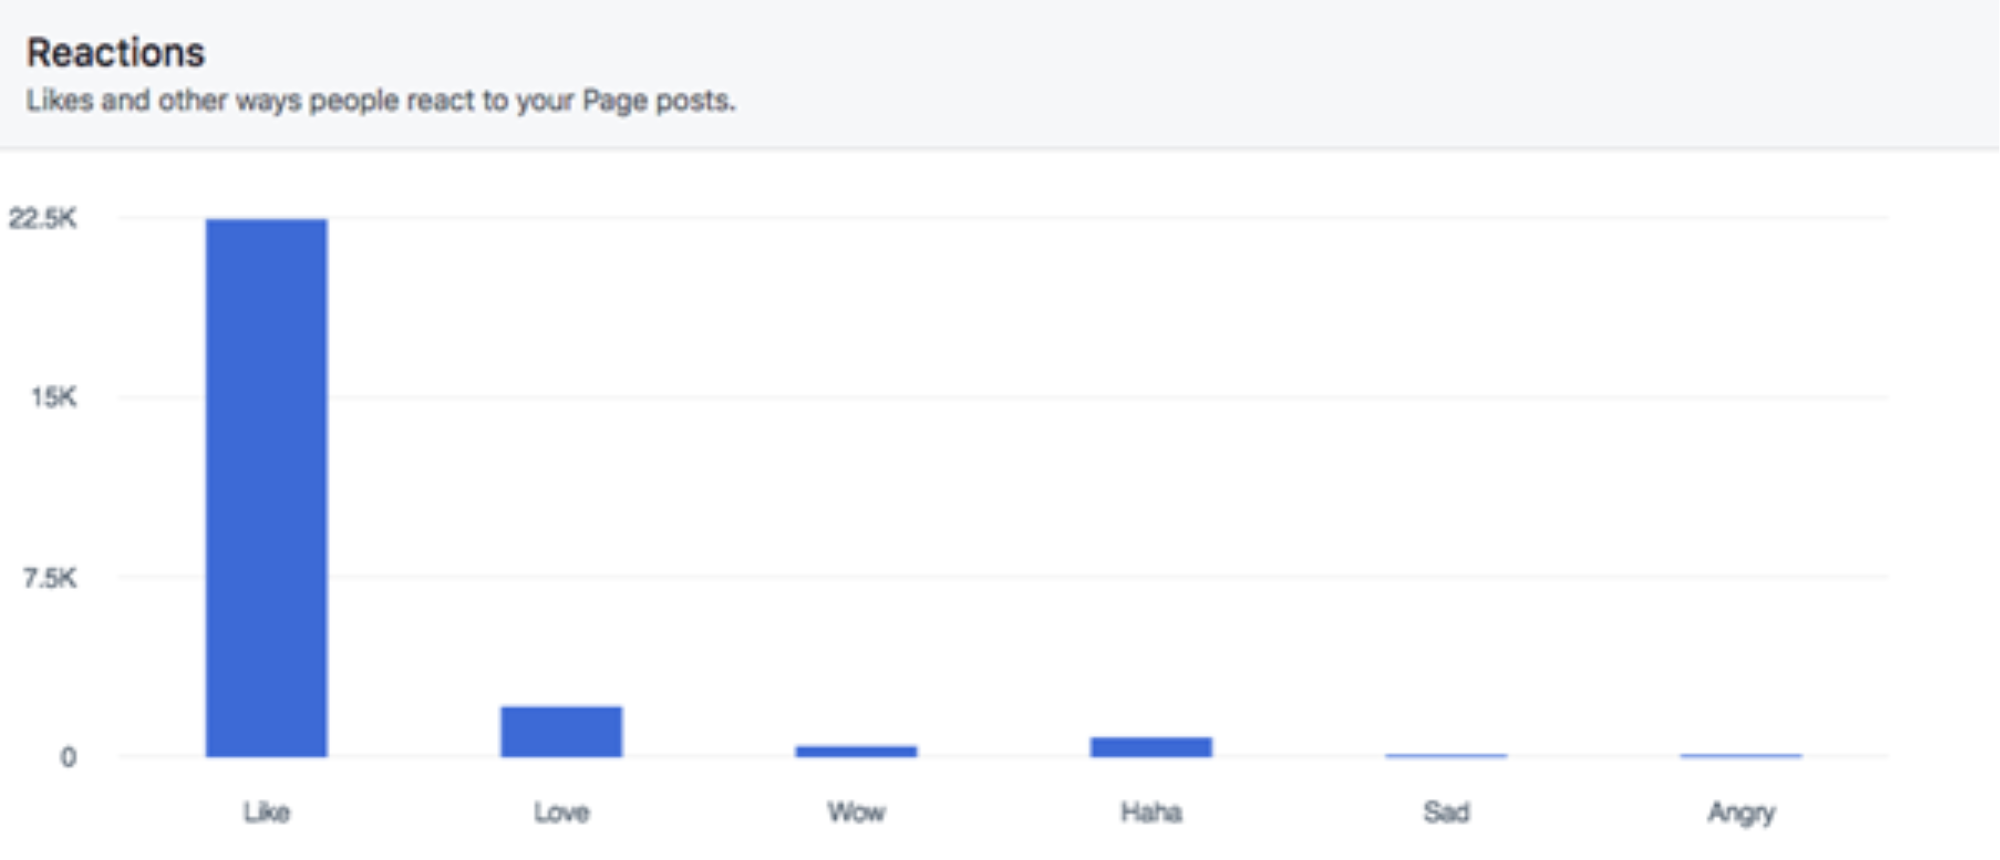
This metric shows which reactions (like, love, wow, etc.) users choose. Desired reactions depend on the post’s nature, and Facebook only provides this breakdown if a post gets enough reactions.
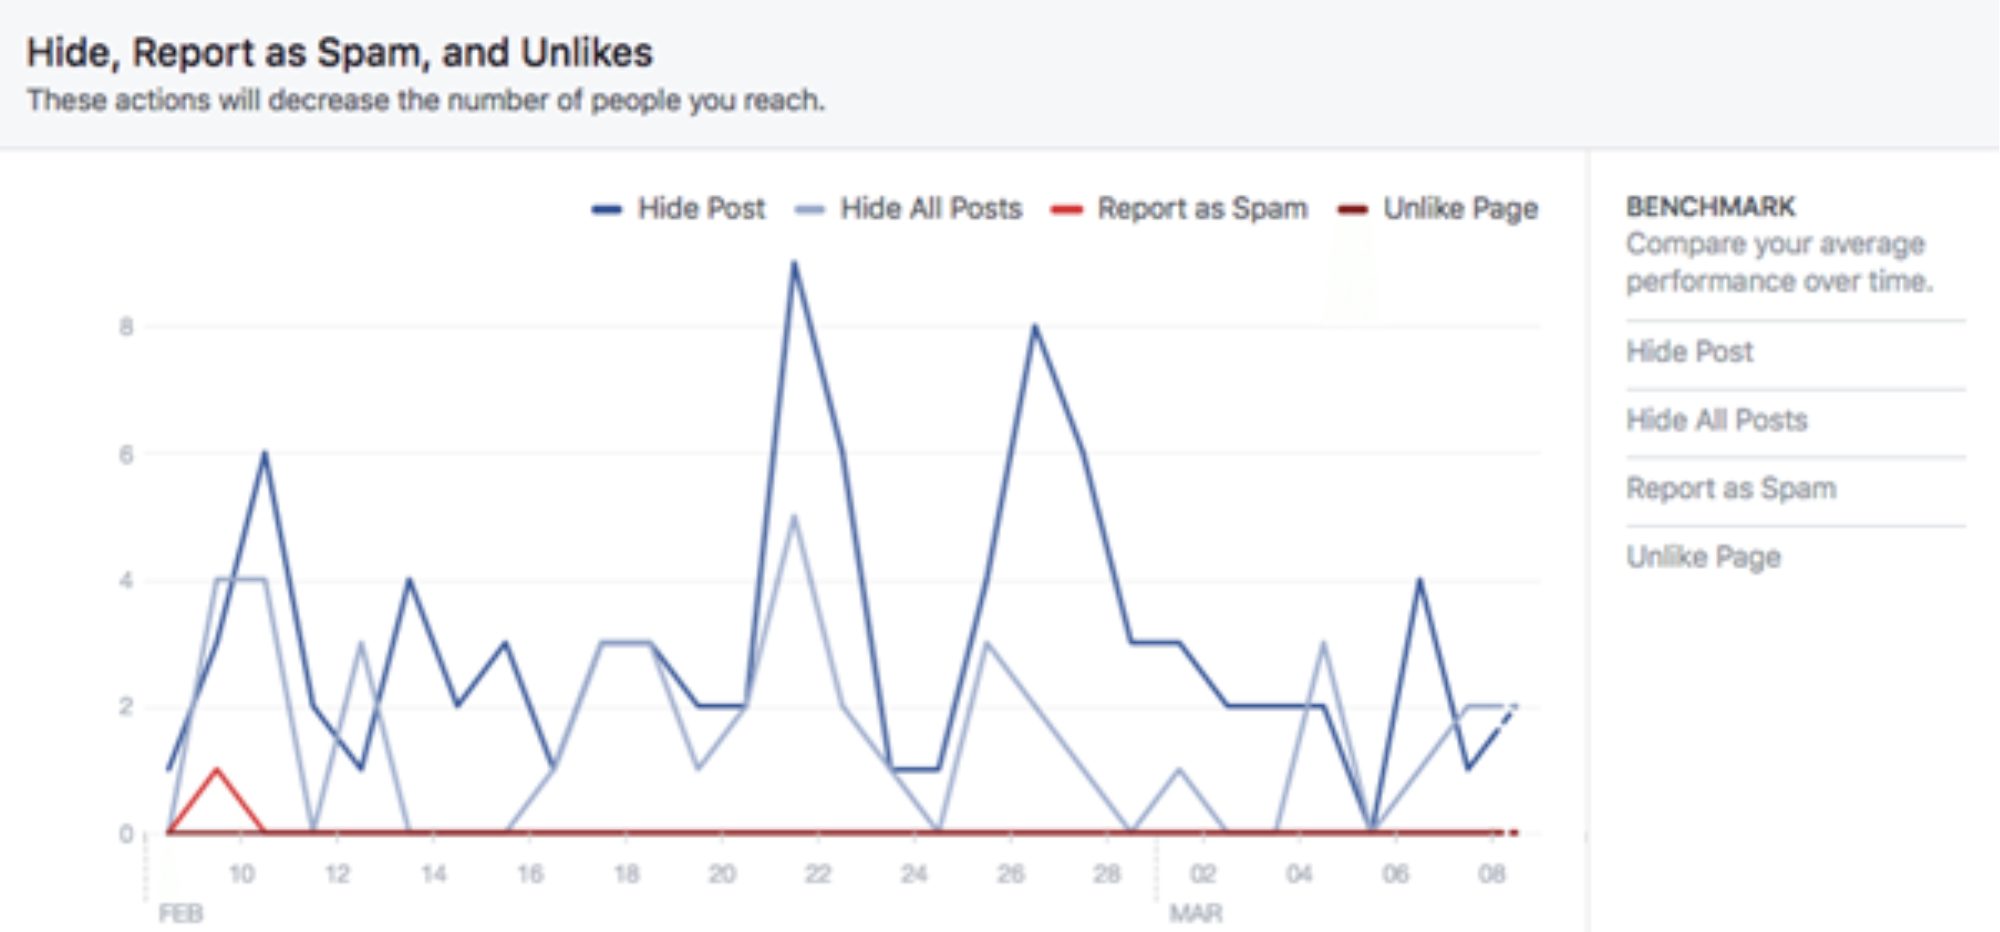
Users can give negative feedback by choosing options like “Hide post” or “Report as spam.” Such feedback reduces a post’s reach in Facebook’s algorithm, so keeping this low is essential.
This metric is similar to Post Reach but includes all Facebook activity, such as ads, mentions, and check-ins. It’s useful for tracking your paid efforts and overall strategy, but don’t overemphasize minor fluctuations if engagement remains steady.
Tip: If you notice a spike in the Reach graph, click or drag to select that area to see your active posts during that time, helping you identify the cause of the change.
Page views
Under Page Views you can discover who views which section of your Facebook page. There are three sections here

This measures how many times people viewed your page, whether from different users or the same user visiting multiple times. You can also break this down by page section.

In this case, each person counts as one view, regardless of how many times they visit, so this number should be equal to or less than Total Views.
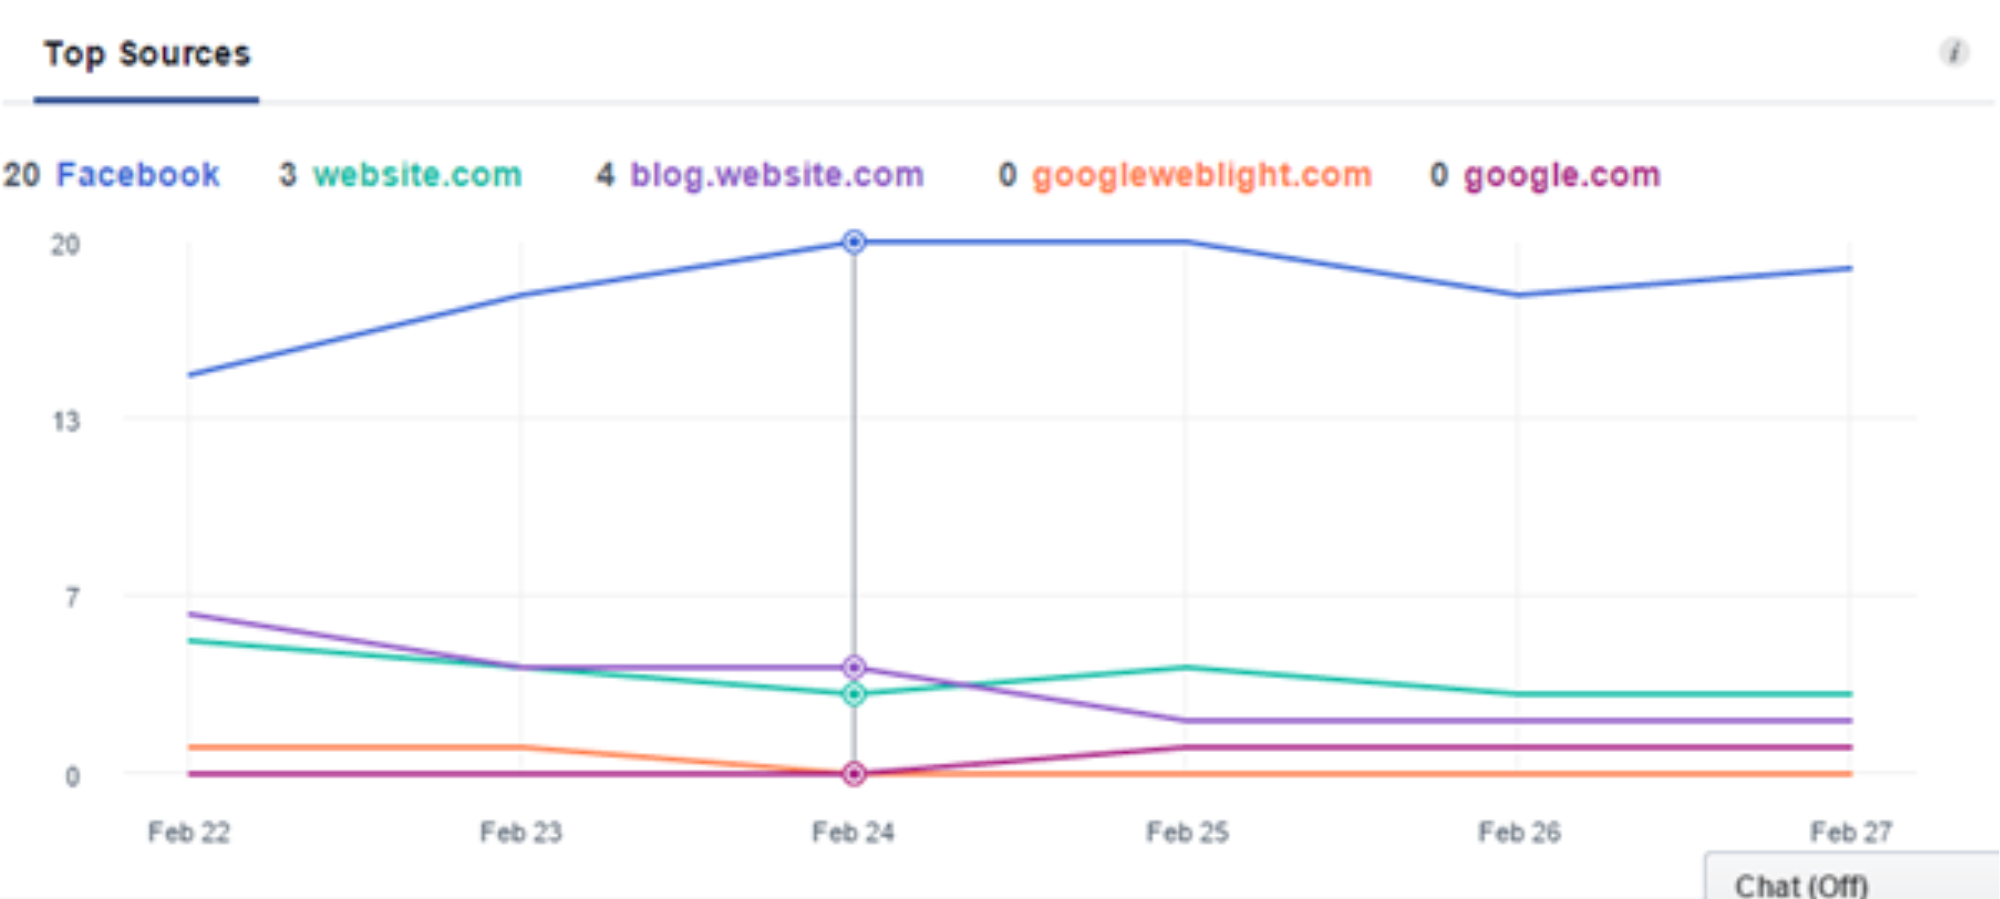
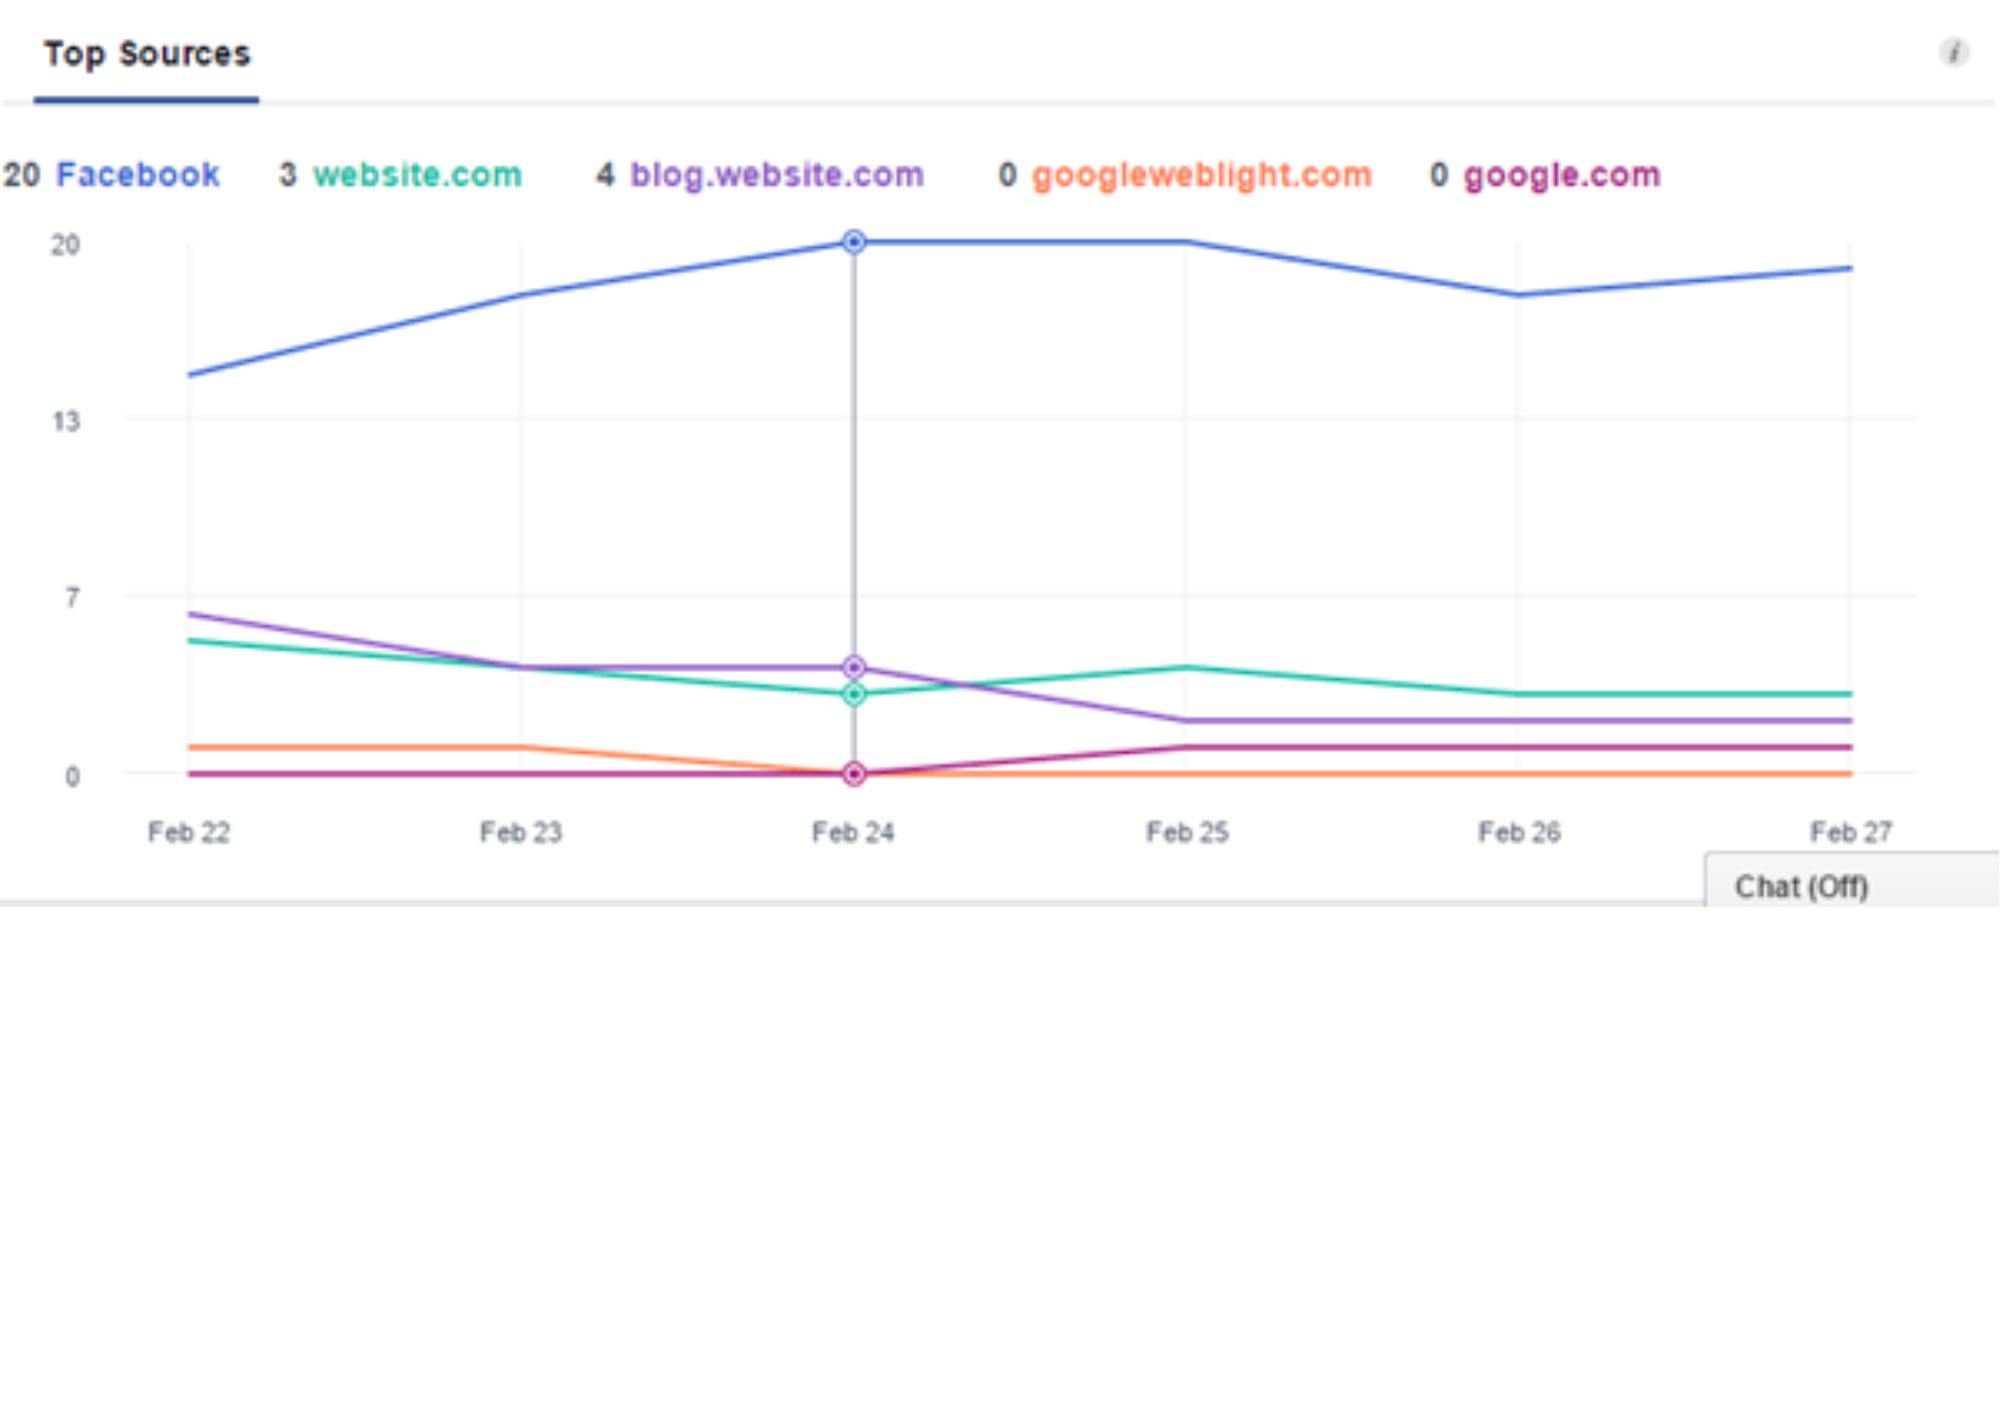
Top Sources: This graph shows the top five traffic sources directing users to your Facebook page, making it one of the most valuable insights under Page Views. You can break this data down by section, age, gender, country, city, and device to better understand your audience.
‘Net likes’ measures new likes minus unlikes. While new likes are positive and can lead to engaged followers, it’s important to monitor unlikes—if they’re increasing, investigate the cause.
Top Sources: This graph shows the top five traffic sources directing users to your Facebook page, making it a key insight under Page Views. Use this information to focus efforts on the sources that drive traffic to boost overall engagement on your page.
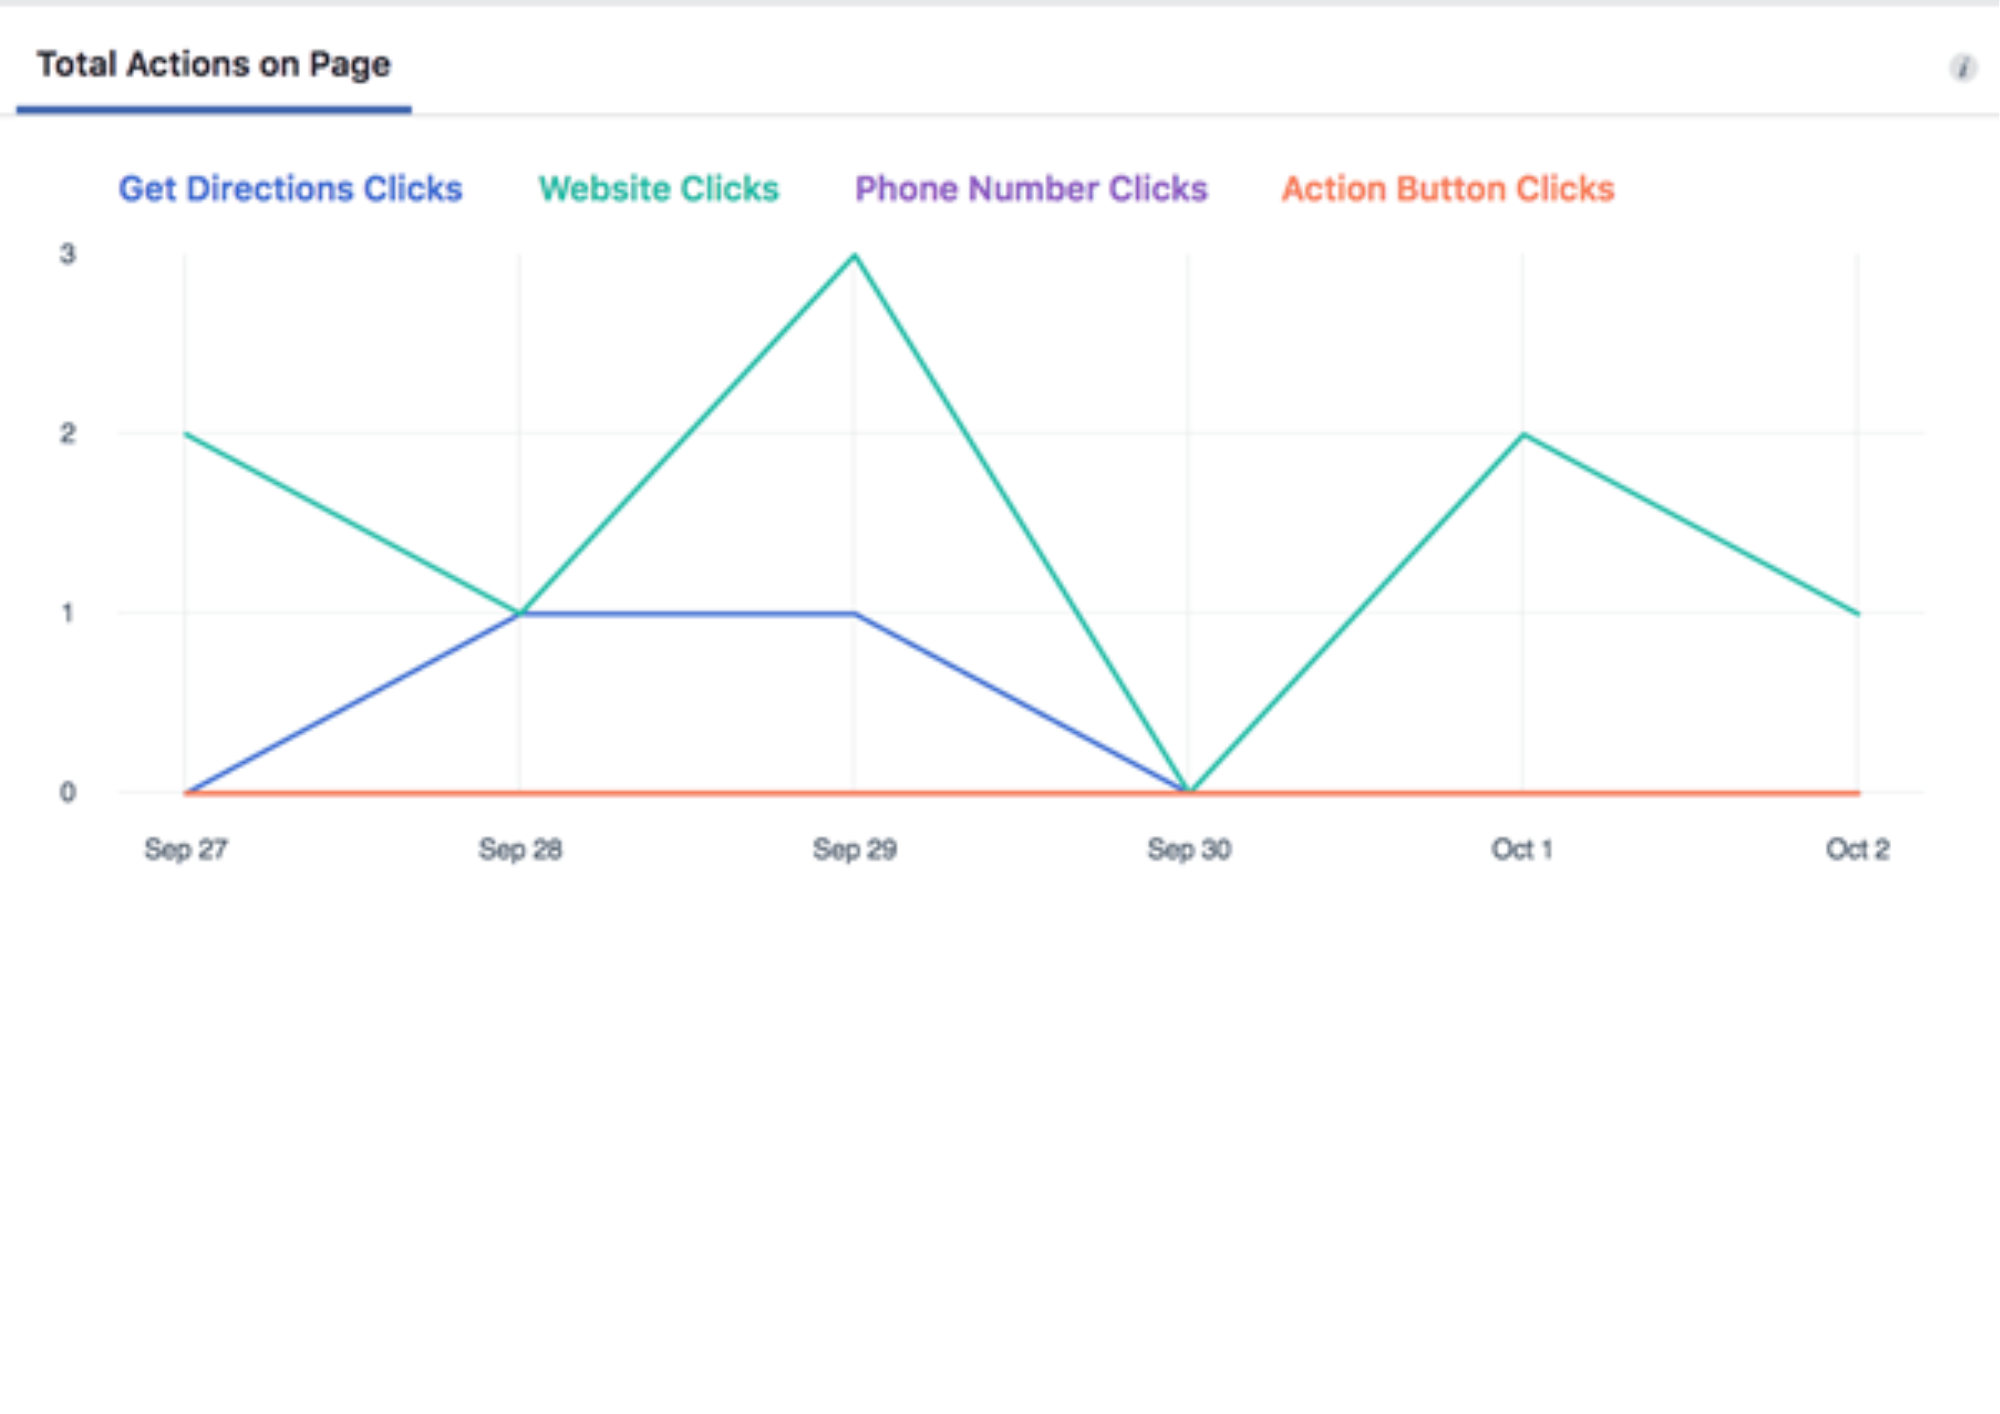
Actions on page
The Actions on Page section shows what users do when they visit your page. Different actions may be more relevant depending on the type of business: a local business may focus on directions, while an online business may prioritize website clicks.
The information includes:
- Total actions on page
- People who clicked action button
- People who clicked get directions
- People who clicked phone number
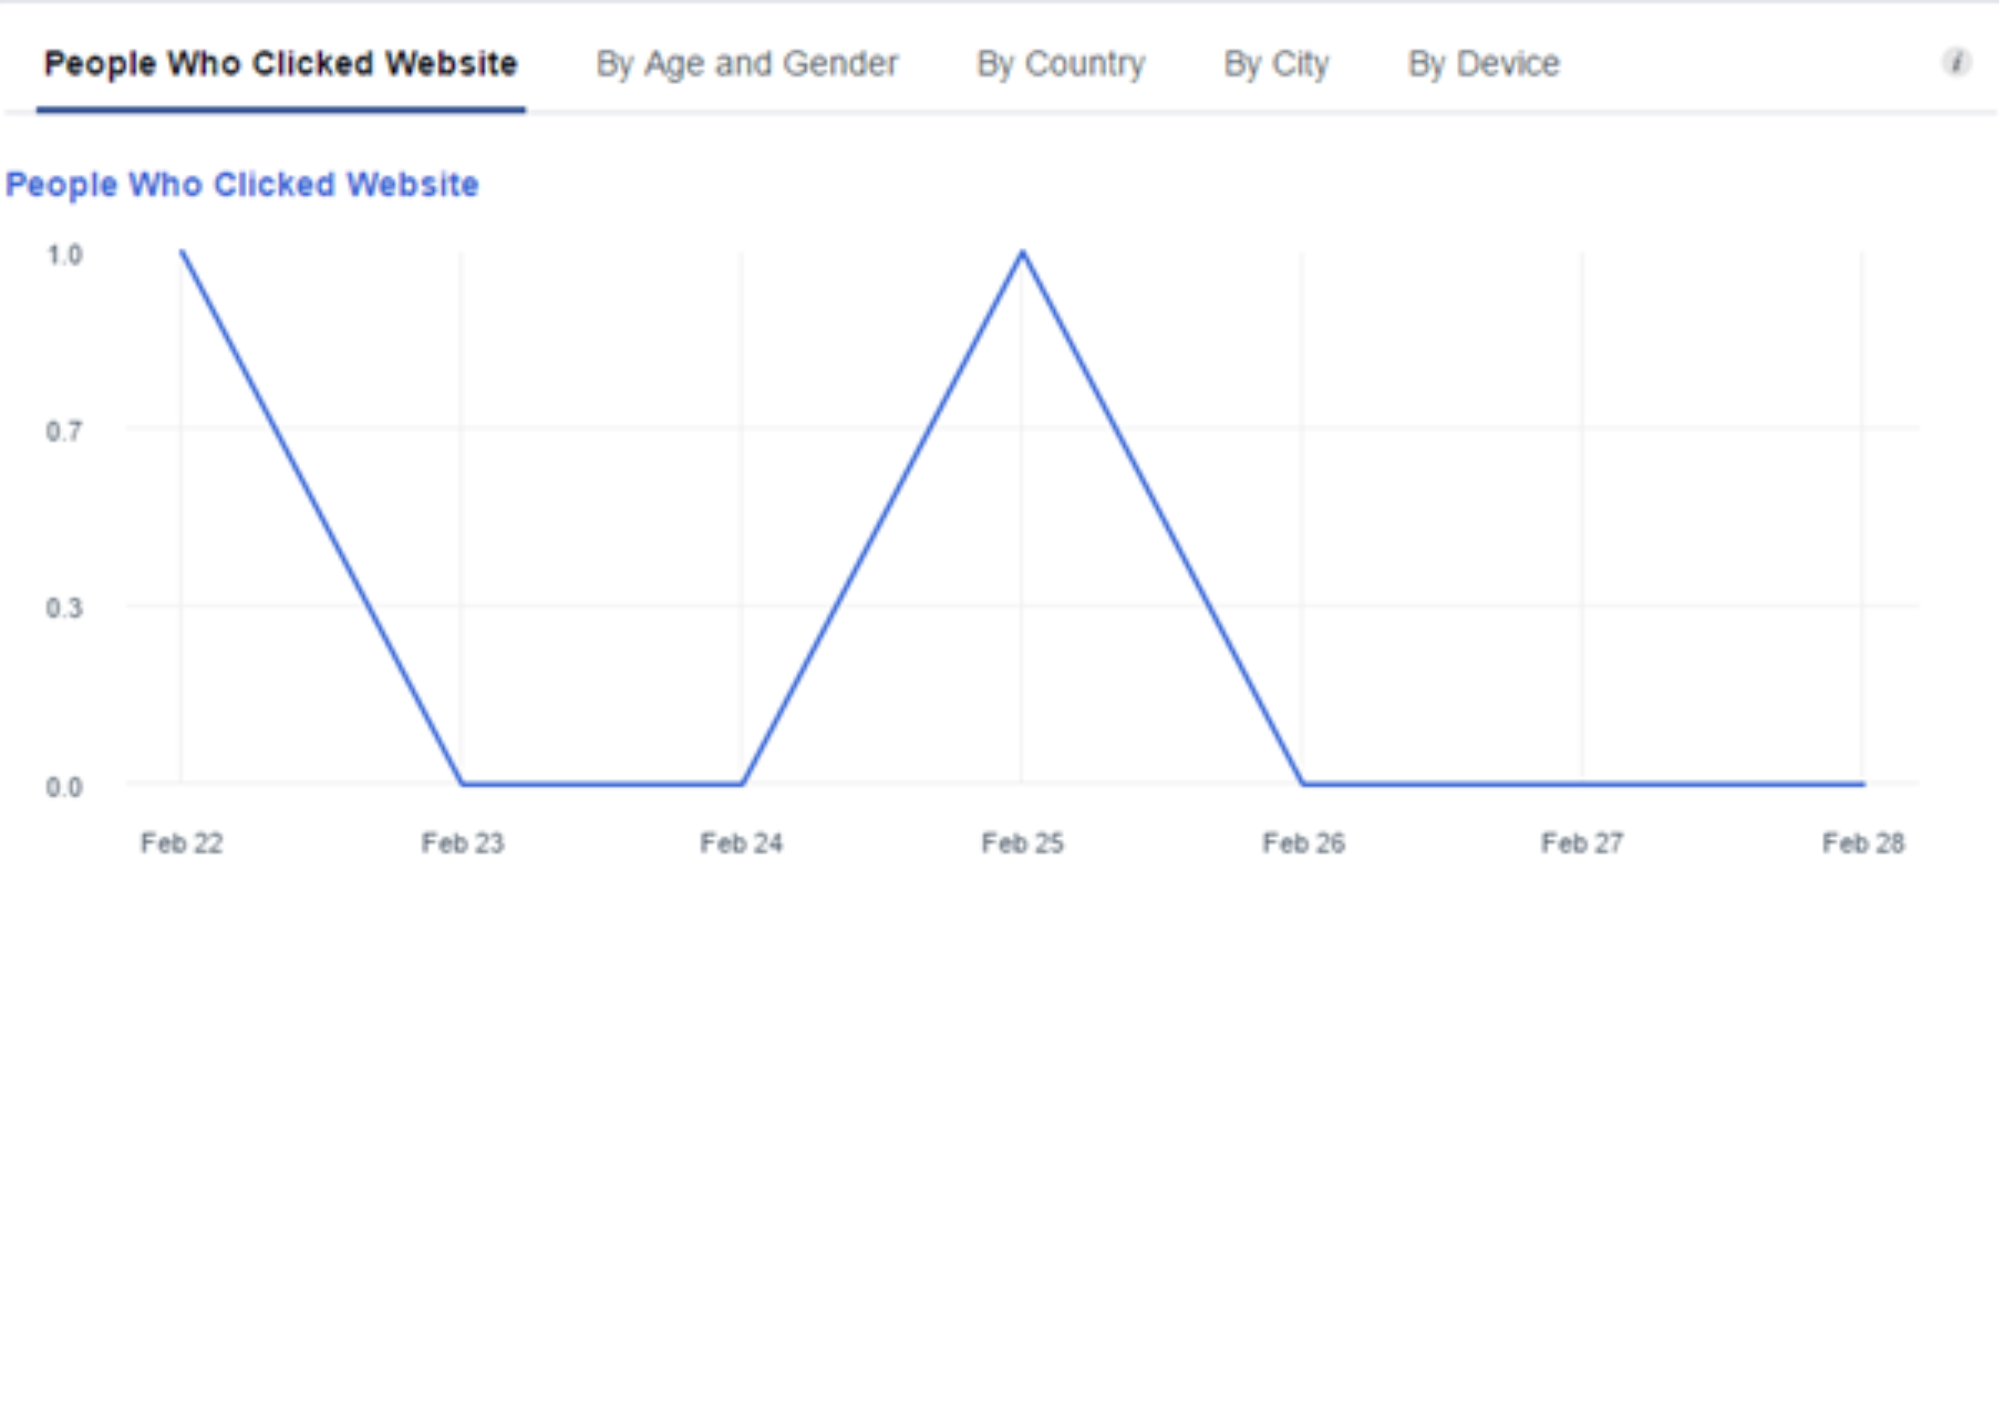
- People who clicked website
This data can also be broken down by demographics, helping you assess whether you’re reaching your target audience effectively.
Posts
There’s tonnes of super valuable information on offer under the Posts section, including:
- When your followers are online
- Post types
- Top posts from pages your watch, and
- All posts published
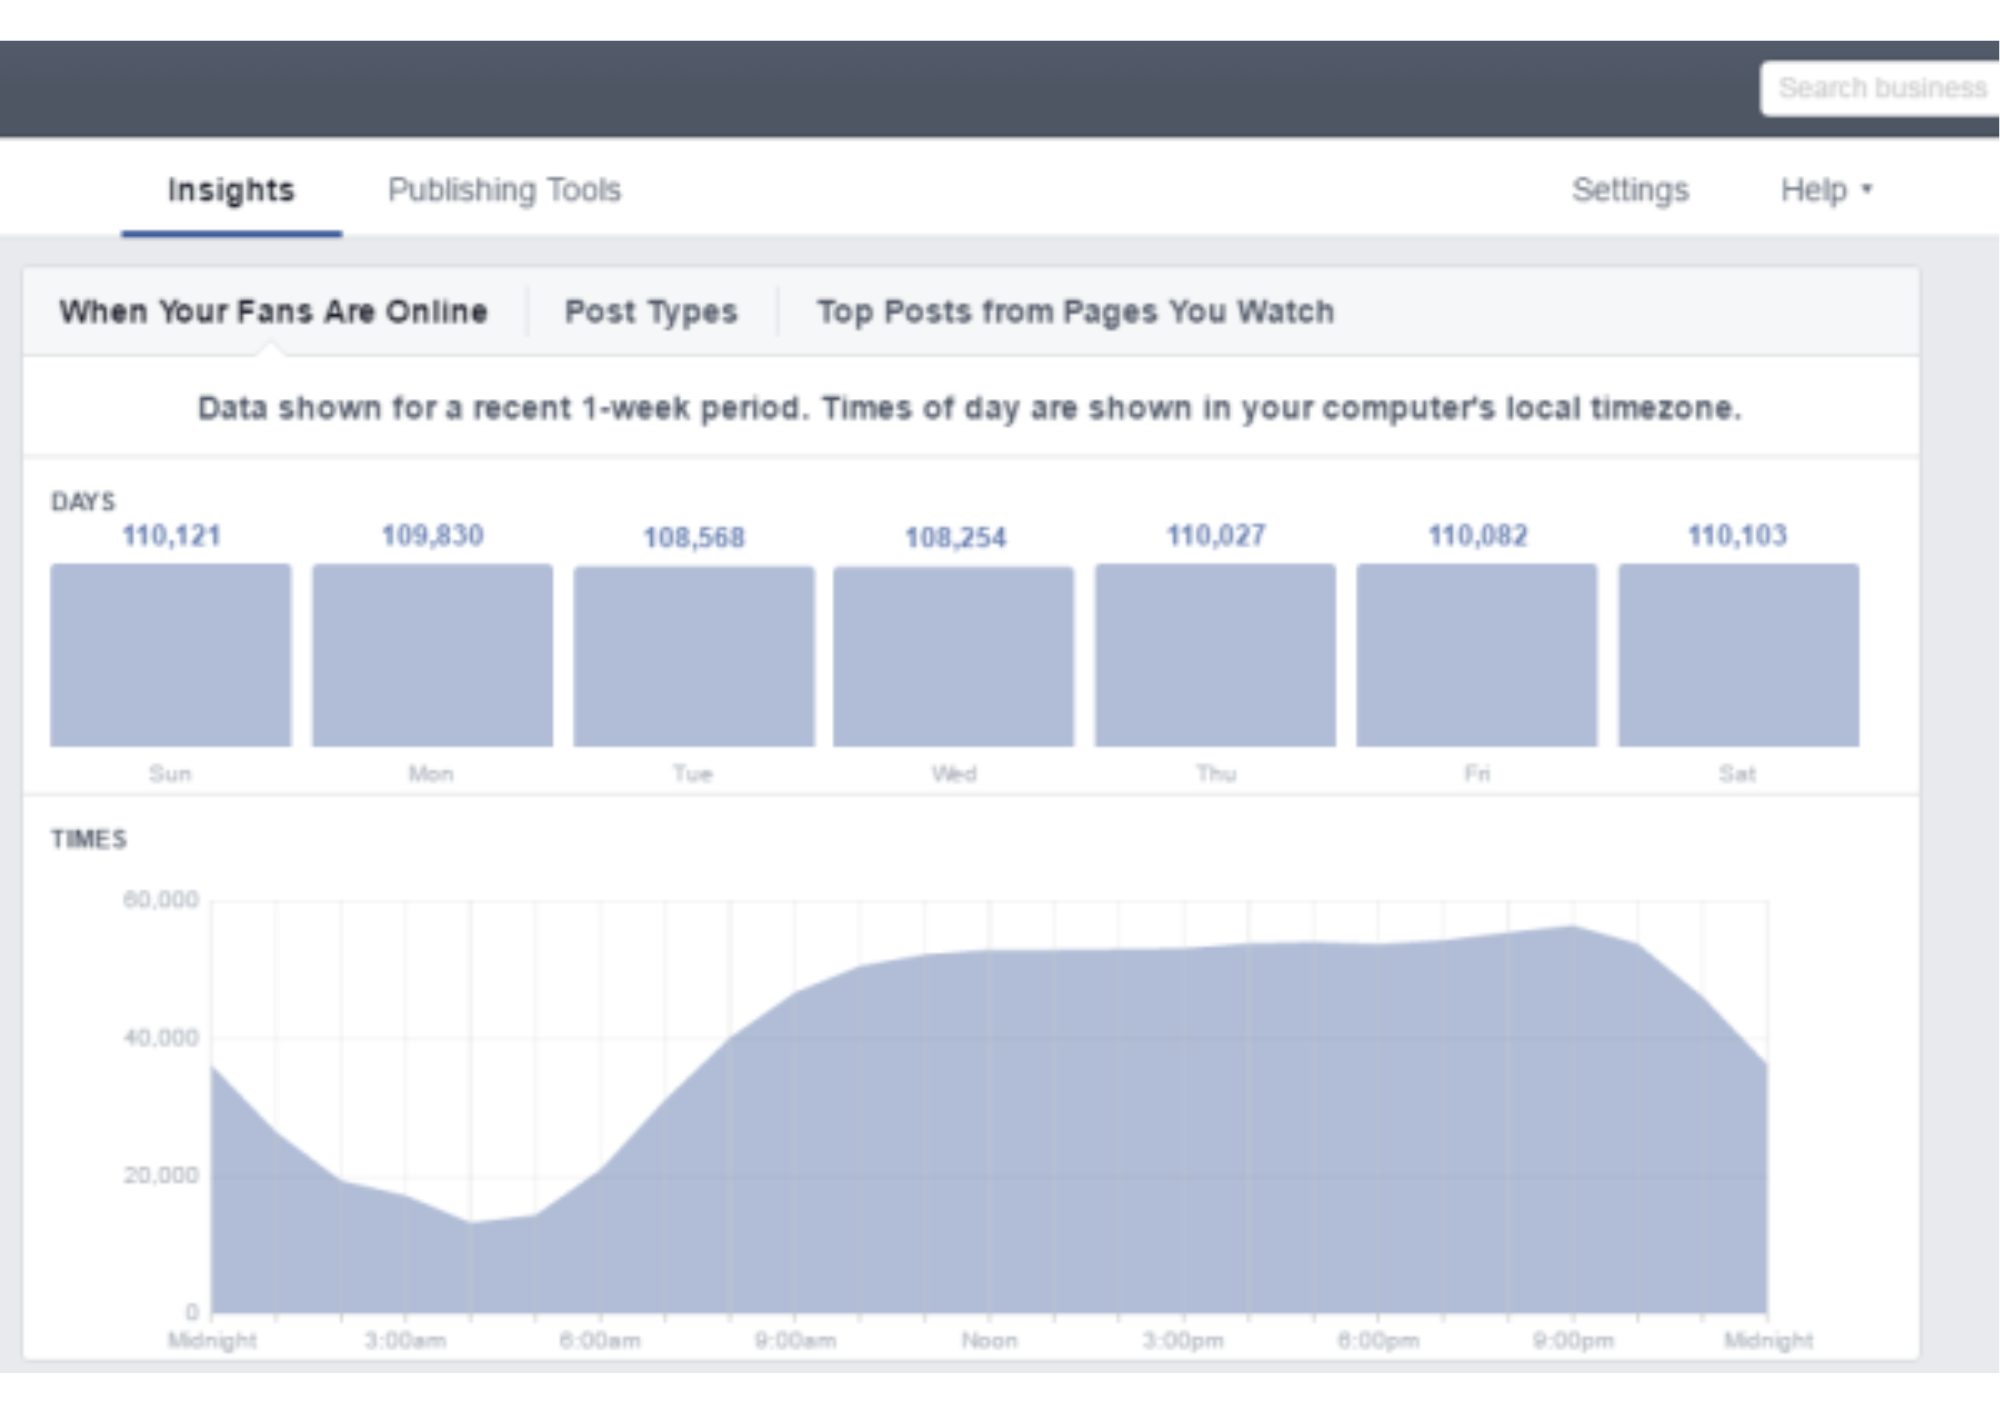
There’s a lot of advice on the best times for businesses to post on social media, but this section of Insights shows when your followers are most active and ready to engage. You’ll find data on follower activity for each day of the week and hour of the day—pretty impressive!
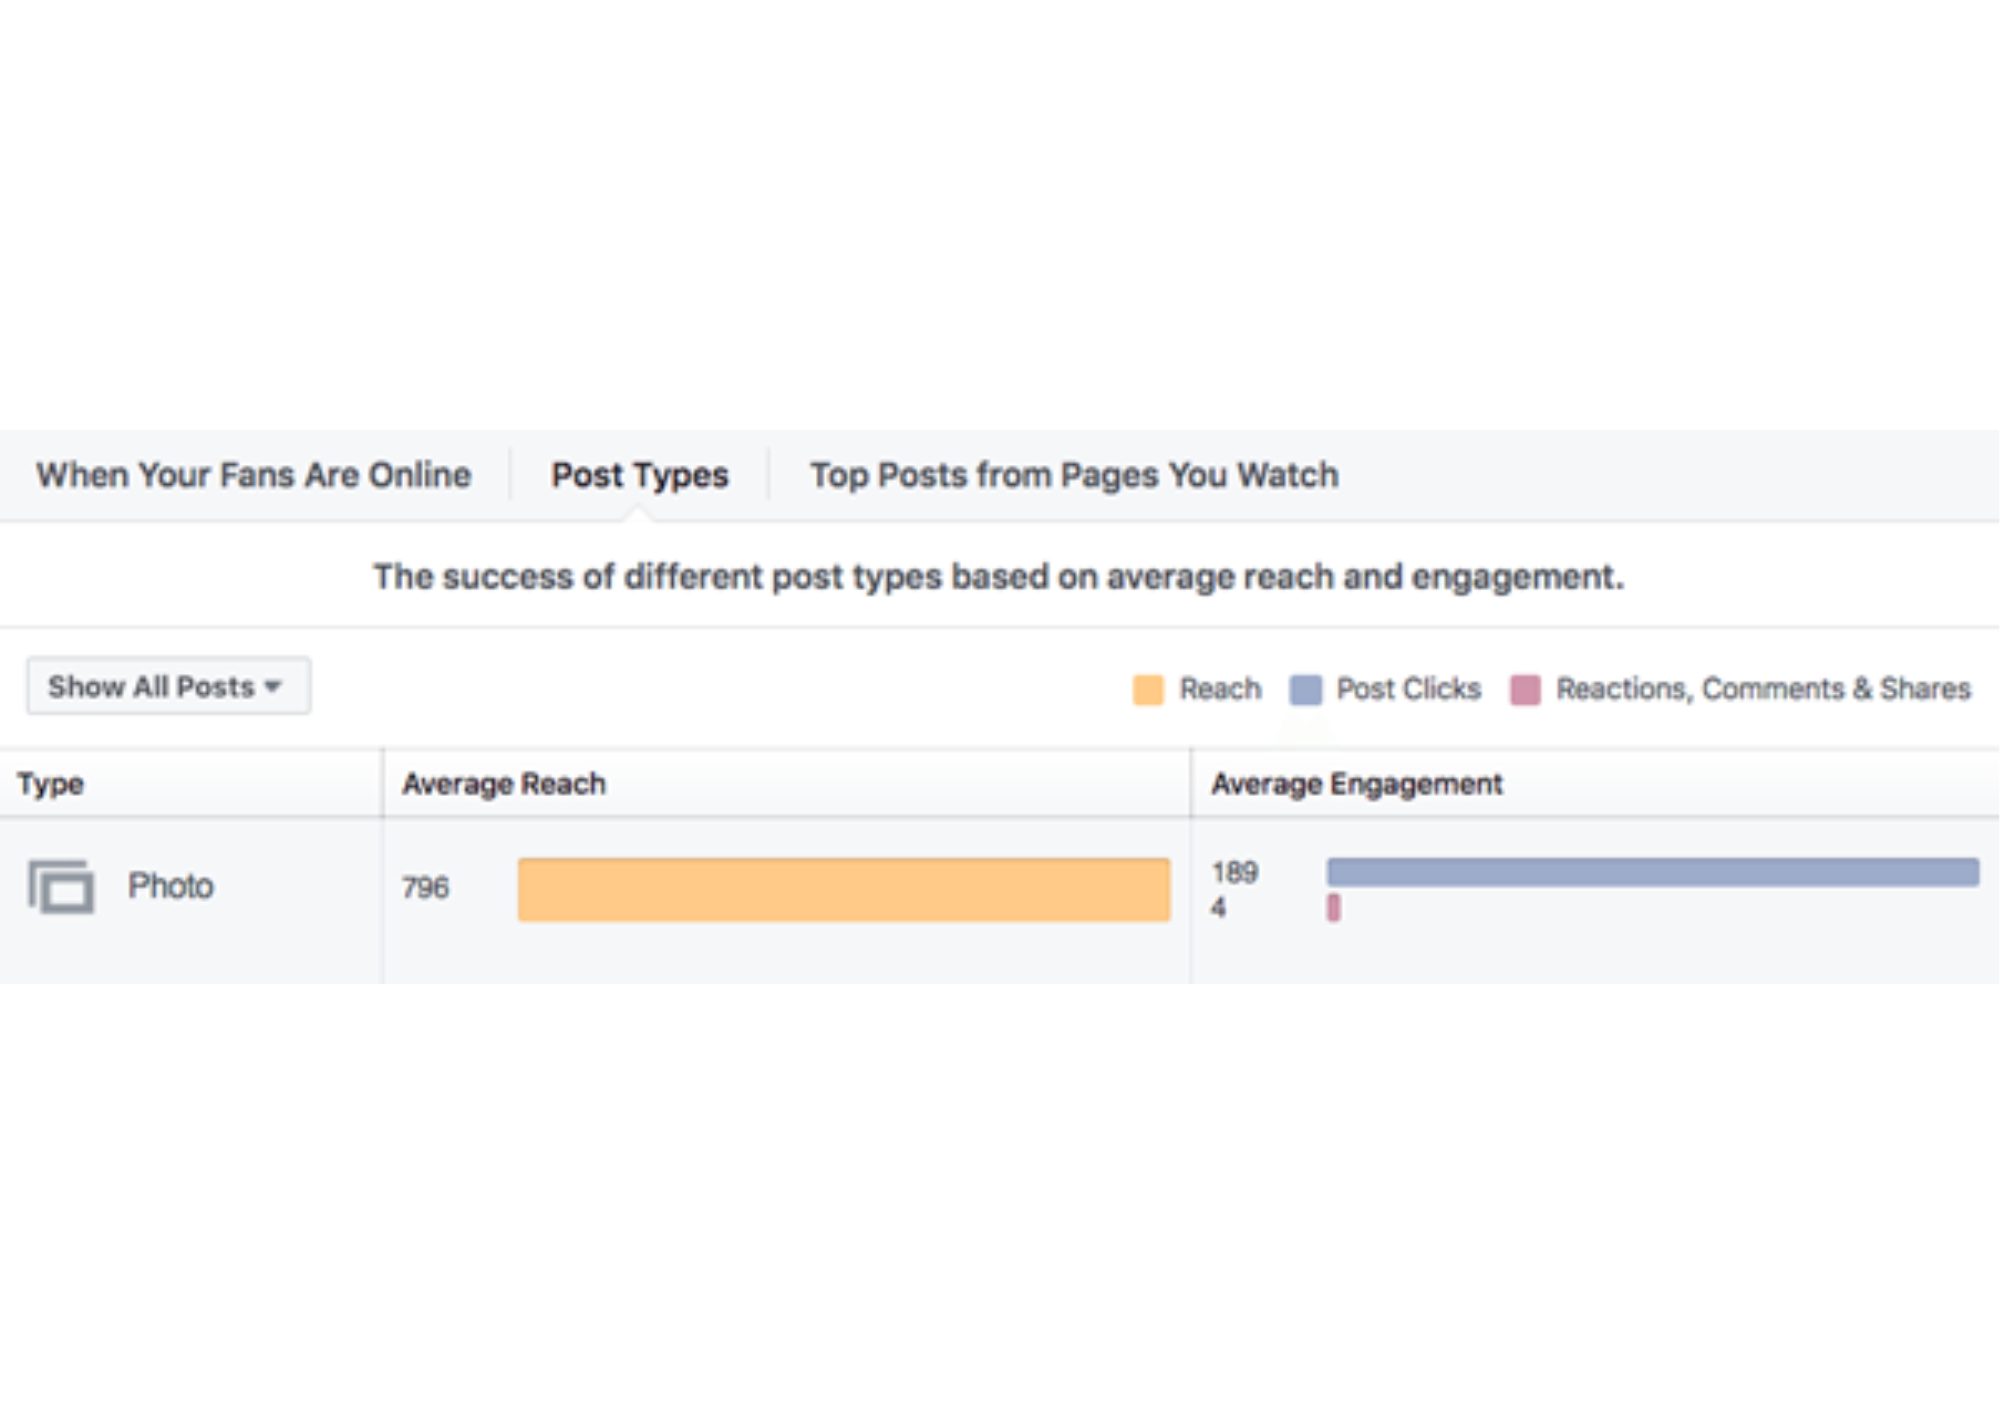
While there’s plenty of advice on which types of content resonate with social media users, the Post Types section provides a breakdown of each content type’s average reach and engagement. Use this data to tailor your content to your audience’s preferences.
This section is similar to the ‘Pages to Watch’ in the Overview tab, but it highlights the top post of the week from each page and its engagement.
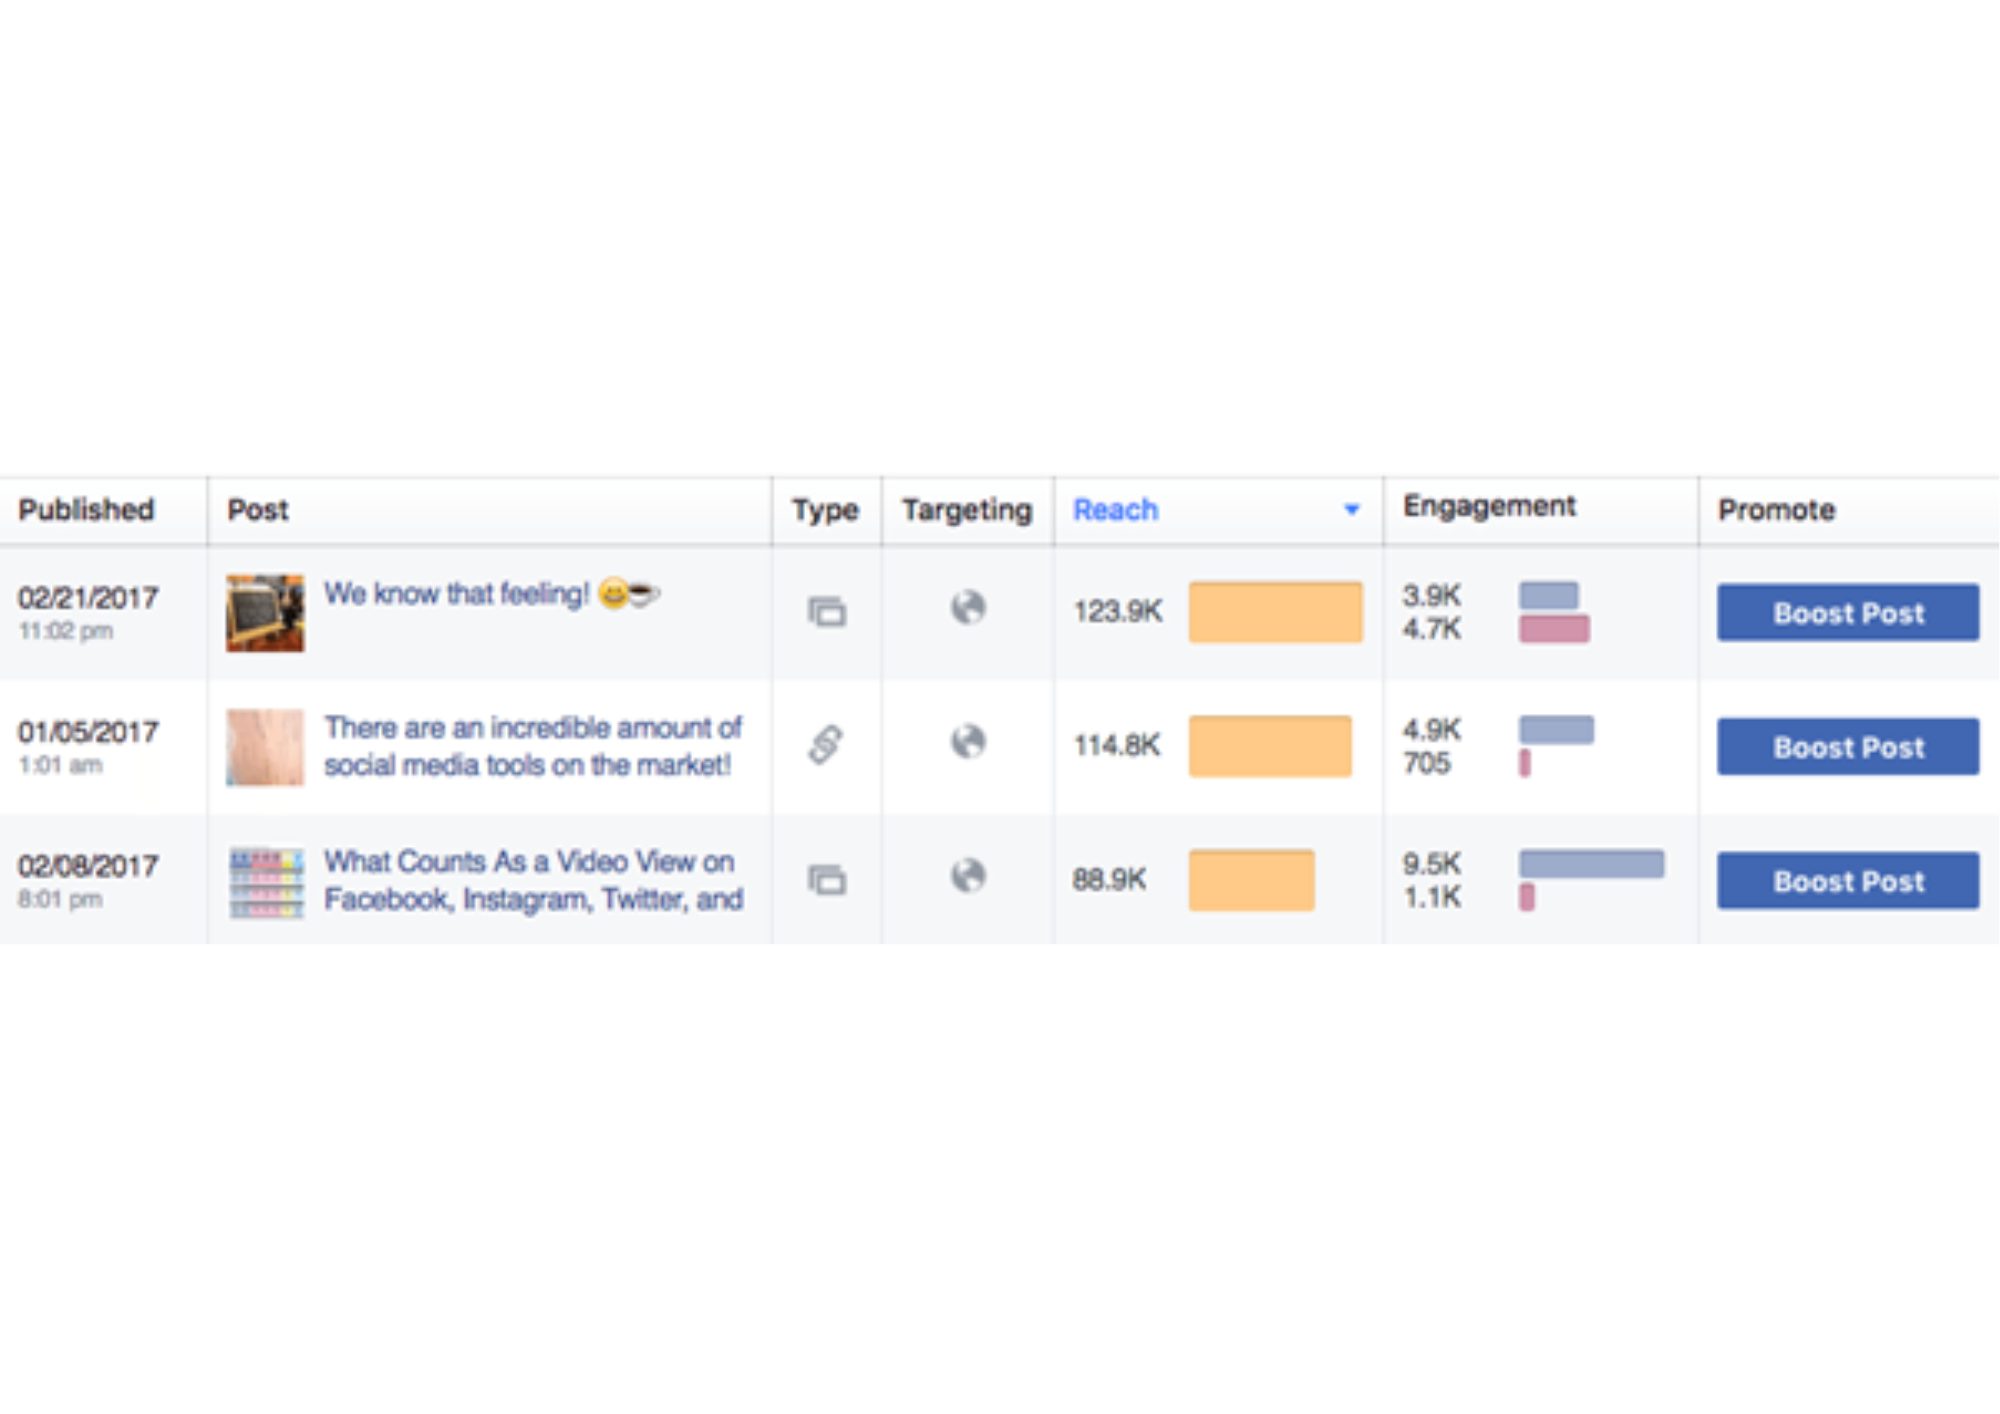
This section is similar to ‘Your five most recent posts’ in the Overview tab but includes all your posts. It displays data on the published date, caption, post type, targeting, reach, and engagement. You can also sort your posts from best to worst in each category by clicking the column title.
Other tabs to keep an eye on
We’ve explored the six key Facebook Insights tabs, but there’s still more to discover if you’re eager for additional insights!